Bitcoin Cash Price Prediction: BCH bulls show resilience as buy-side pressure builds
- Bitcoin Cash trades higher on Wednesday after finding support around a key level the previous day.
- Derivatives and on-chain data indicate that BCH’s Open Interest is rising, Spot Taker CVD is turning positive and trending upward.
- The technical outlook suggests further gains, targeting levels above $500.

Bitcoin Cash (BCH) is showing signs of resilience, trading higher at $473 at the time of writing on Wednesday, despite rising geopolitical conflicts, and has found support around a critical level. Derivatives and on-chain data support the bullish thesis as BCH Open Interest (OI) and Spot Taker Cumulative Volume Delta (CVD) are rising, signaling increased buy-side dominance. The technical outlook projects further gains, targeting levels above $500.
BCH bulls remain strong despite rising geopolitical conflicts
Bitcoin Cash bulls have shown resilience and strength despite rising tensions between Iran and Israel, with the cryptocurrency trading nearly 4% higher so far this week.
CryptoQuant data, as shown in the graph below, indicates an increase in buying pressure on Bitcoin Cash. The Taker CVD for BCH is positive, increasing since early May and reaching levels not seen since February. This indicator measures the cumulative difference between market buy and sell volumes over a three-month period. When 90-day CVD is positive and increasing, it suggests the Taker Buy Dominant Phase, while a negative and decreasing value indicates the Taker Sell Dominant Phase.
-1750225195341.png)
BCH Spot Taker CVD chart. Source: CryptoQuant
The derivatives data further supports the bullish thesis. CoinGlass’ data shows that the futures’ OI in BCH at exchanges rose to $485.24 million on Wednesday from $312.62 million on June 13, the highest level since mid-April. An increasing OI represents new or additional money entering the market and new buying, which could fuel the current price rally in Bitcoin Cash.
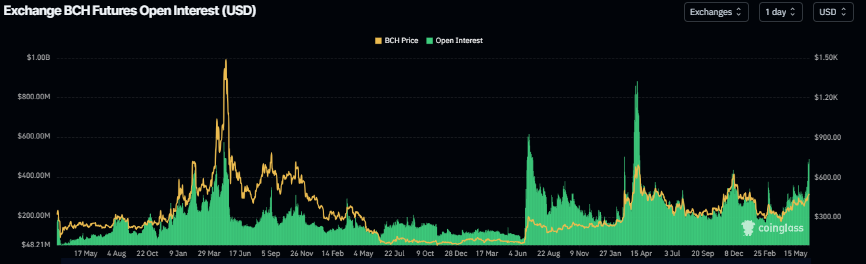
BCH Open Interest chart. Source: Coinglass
CoinGlass’s OI-Weighted Funding Rate data shows that the number of traders betting that the price of Bitcoin Cash will slide further is lower than that anticipating a price increase. The metric flipped to a positive rate on Monday and rose to 0.0058% on Wednesday, indicating that longs are paying shorts, which suggests bullish sentiment.
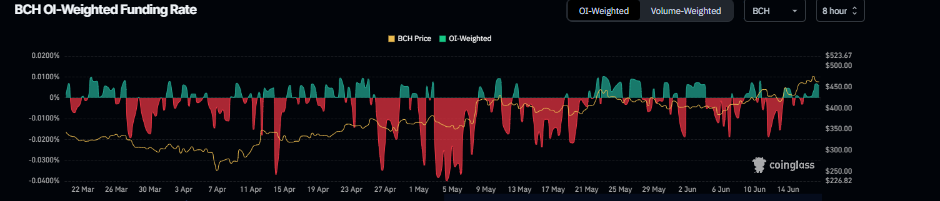
BCH funding rate chart. Source: Coinglass
Bitcoin Cash Price Prediction: BCH bulls target levels above $500
Bitcoin Cash price rebounded after retesting the 50-day Exponential Moving Average (EMA) at $409.2 on Friday and rallied nearly 10% until Monday, closing above its daily resistance at $459.2. On Tuesday, BCH retested and consolidated around this daily level. At the time of writing on Wednesday, it is trading higher by nearly 2.5% at $473.5.
If BCH continues its upward trend, it could extend the rally toward its January 17 high of $500.6. A successful close above this level could extend the rally toward the next daily resistance at $542.50.
The Relative Strength Index (RSI) indicator on the daily chart reads 66, pointing upwards below overbought conditions and indicating strong bullish momentum. Additionally, the Moving Average Convergence Divergence (MACD) indicator on the daily chart displayed a bullish crossover last week. It also shows rising green histogram bars above its neutral level, indicating bullish momentum and suggesting an upward trend.
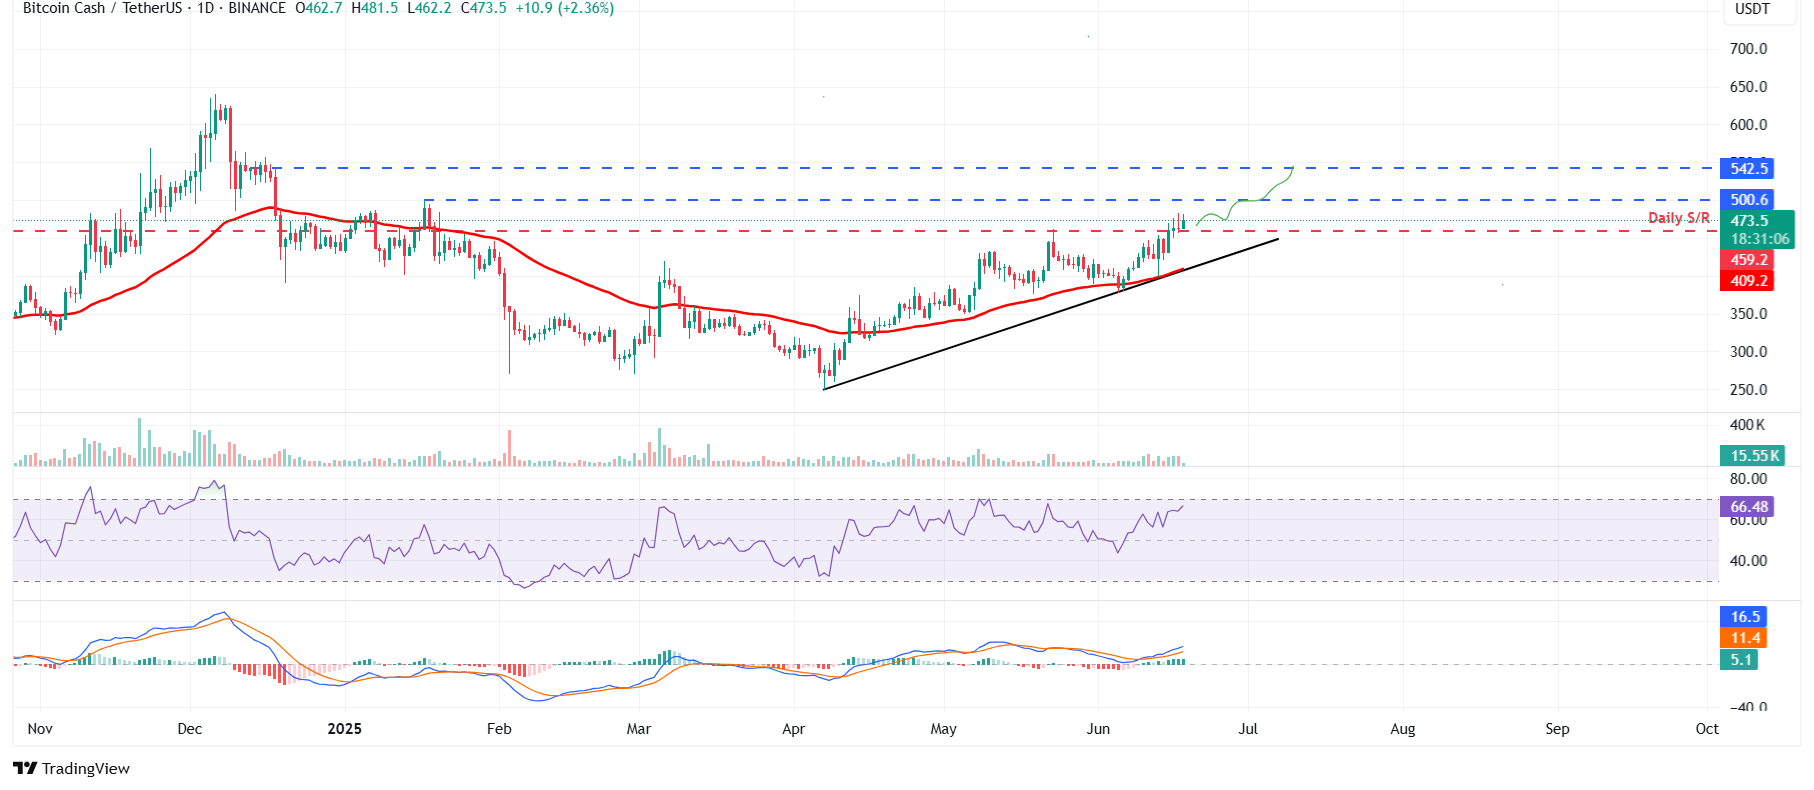
BCH/USDT daily chart
However, if BCH closes below its daily support at $459.2, it could extend the decline to retest the 50-day EMA at $409.2.
Author

Manish Chhetri
FXStreet
Manish Chhetri is a crypto specialist with over four years of experience in the cryptocurrency industry.


