Bitcoin Cash Price Forecast: BCH forced into consolidation between strong levels – Confluence Detector
- BCH is presently sandwiched between the 100-day and 200-day SMAs.
- The number of addresses entering the network has recently dropped.

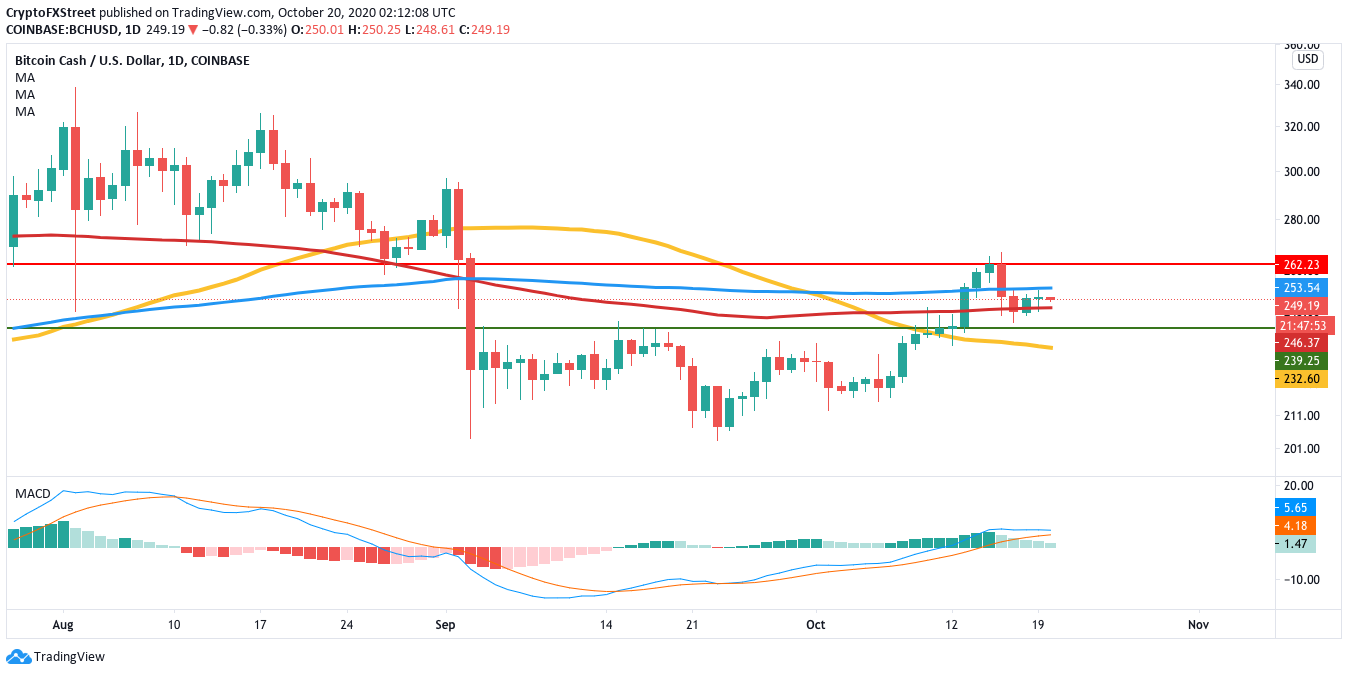
Bitcoin Cash plummeted from $292.25 to $207.30 between September 2 to September 23. Following that, the price recovered till October 15, hitting the $262.65 resistance line. Since then, the Bitcoin fork has dropped to $249 and is trapped between the 100-day SMA ($253) and 200-day SMA ($246). The MACD also shows decreasing bullish market momentum, which doesn’t bode well for the buyers.
BCH/USD daily chart
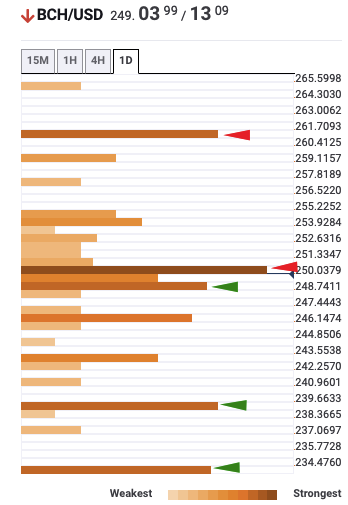
As per the daily confluence detector, there are three healthy support levels at the 200-day SMA ($246), $239 and the 50-day SMA ($232.50). These appear strong enough to absorb an immense amount of selling pressure, capping off the downside at $232.50. A break below these support walls will trigger a fall to $220.
BCH daily confluence detector
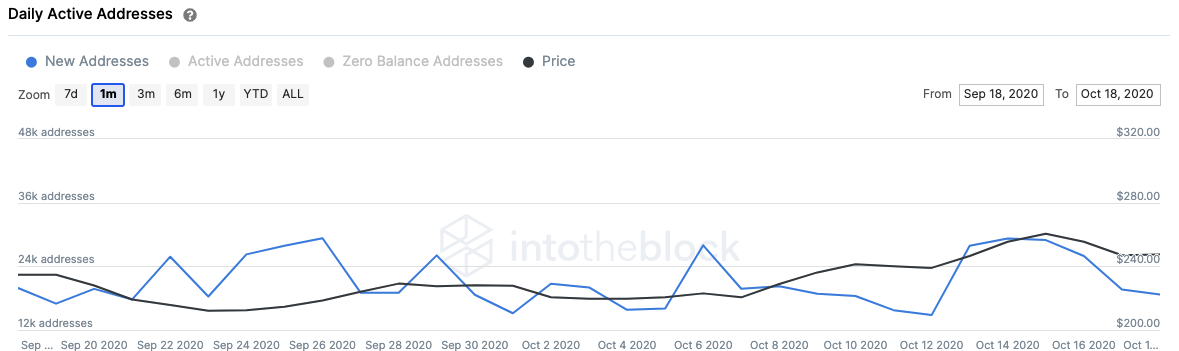
To add further credence to our bearish outlook, we can see that the number of addresses entering the network per day. This is a negative sign as declining network growth is usually indicative of a future slumping price. As per the chart, the number of new addresses entering the system reached a high of 29,230 on October 14, over the last month. Since then, the number has dropped to only 18,700, as of writing.
BCH daily active addresses
The Flipside: Can the bulls take back control?
So, while the outlook for now looks pretty gloomy, the buyers can turn this narrative around by conquering two specific levels. Firstly, it needs to cross over the 100-day SMA ($253) and then take over the $262.65 resistance line. By taking control of these resistance walls, Bitcoin Cash should reach $300.
It looks like the whales have been buying the dip. As per Santiment, the number of addresses holding 10,000-100,000 tokens went up from 166 to167 over the last two days. While this may sound negligible, keep in mind that these addresses hold hundreds of thousands of dollars worth of BCH.
BCH holders distribution
 [07.57.02, 20 Oct, 2020]-637387617664311545.png)
Key price levels to watch
The downside is capped by the 200-day SMA ($246), $239 and the 50-day SMA ($232.50) for the BCH bears. These levels are strong enough to absorb immense amounts of sell pressure.
The most urgent task for the bulls is to flip the 100-day SMA ($253) from resistance to support. A break above this resistance barrier should give them enough momentum to aim for the $262.65 resistance.
Author

Rajarshi Mitra
Independent Analyst
Rajarshi entered the blockchain space in 2016. He is a blockchain researcher who has worked for Blockgeeks and has done research work for several ICOs. He gets regularly invited to give talks on the blockchain technology and cryptocurrencies.



