- Bitcoin Cash rejection at $280 opened the Pandora box, leaving the cryptoasset in the bears’ hands.
- The support provided by the 50-day SMA must remain intact if BCH is to invalidate the potential breakdown to $200.
The cryptocurrency market is trading in a period of high volatility, mainly brought about by the ongoing presidential elections in the United States. Bitcoin Cash was recently rejected from $280, leaving the button in the bears’ hands. The reversal that ensued from the resistance stretched beyond tentative support areas at $260 and $240. At the moment, BCH is dancing slightly above $241 while seeking support at $240.
Bitcoin Cash hangs at the edge of a high cliff
The daily chart highlights a recently broken ascending wedge pattern that added weight to the bearish outlook. Bitcoin Cash bears forcefully pushed below the pattern and the 100 Simple Moving Average (SMA), where it refreshed support at $240.
For now, BCH is holding firmly onto the 50 SMA. If this short term support gives in to the selling pressure, the cryptoasset may dive sharply to the primary support at $200. However, buyer congestion at $220 could cushion BCH/USD from the seemingly imminent dive. Besides, the Relative Strength Index (RSI) downward gradient shows that sellers have the upper hand.
BCH/USD daily chart
IntoTheBlock’s IOMAP model reveals intensifying seller congestion ahead of Bitcoin Cash. The most robust resistance runs from $263 to $269. Here, nearly 140,000 addresses previously bought 2.1 million BCH. If BCH managed to rise to this level, a rejection could send it back to $240.
Bitcoin Cash IOMAP chart
On the downside, the model brings to light the lack of a strong enough support to stop the potential breakdown to $200. However, slightly higher buyer congestion between $233 and $240 is in line to cushion the digital asset from the drop. Here, approximately 102,000 addresses previously purchased roughly 458,000 BCH.
Looking at the other side of the picture
A buy signal presented recently by the TD Sequential indicator on the 4-hour timeframe could help invalidate the bearish outlook. If Bitcoin Cash closes above the 200 SMA, it would call for more buy orders, perhaps creating enough volume to overcome the seller congestion at $260.
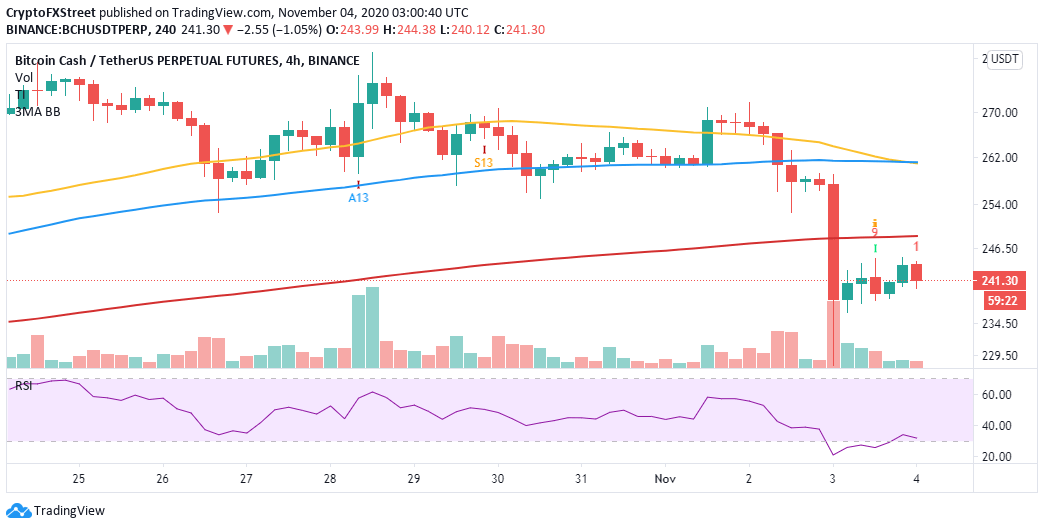
BCH/USD 4-hour chart
In the event of an upswing, bulls would have to hold firmly to the 50-day SMA as support to put in jeopardy the bearish scenario.
Information on these pages contains forward-looking statements that involve risks and uncertainties. Markets and instruments profiled on this page are for informational purposes only and should not in any way come across as a recommendation to buy or sell in these assets. You should do your own thorough research before making any investment decisions. FXStreet does not in any way guarantee that this information is free from mistakes, errors, or material misstatements. It also does not guarantee that this information is of a timely nature. Investing in Open Markets involves a great deal of risk, including the loss of all or a portion of your investment, as well as emotional distress. All risks, losses and costs associated with investing, including total loss of principal, are your responsibility. The views and opinions expressed in this article are those of the authors and do not necessarily reflect the official policy or position of FXStreet nor its advertisers. The author will not be held responsible for information that is found at the end of links posted on this page.
If not otherwise explicitly mentioned in the body of the article, at the time of writing, the author has no position in any stock mentioned in this article and no business relationship with any company mentioned. The author has not received compensation for writing this article, other than from FXStreet.
FXStreet and the author do not provide personalized recommendations. The author makes no representations as to the accuracy, completeness, or suitability of this information. FXStreet and the author will not be liable for any errors, omissions or any losses, injuries or damages arising from this information and its display or use. Errors and omissions excepted.
The author and FXStreet are not registered investment advisors and nothing in this article is intended to be investment advice.
Recommended Content
Editors’ Picks
Ripple's move above this key level could trigger nearly 50% rally for XRP
Ripple has overcome a critical resistance level and flipped into a support floor on the weekly time frame. This development happened while XRP tightly consolidated for roughly 250 days. Investors can expect XRP to kickstart a massive rally.
Optimism price outlook with nearly $90 million worth of OP tokens flooding markets on Friday
Optimism volatility has shrunk in the ours leading to the network’s cliff unlock. It joins the likes of dYdX and Sui, which have similar events on their calendars. As token unlocks are often considered bearish catalysts, investors should brace for a reaction after the event.
Top 3 Price Prediction Bitcoin, Ethereum, Ripple: Retail watches from the sidelines with a bias for shorts
Bitcoin could clear $73,777 peak as BTC bulls resurface. Ethereum might fall 10% before next leg up as ETH RSI teases with sell signal. XRP could lose $0.6000 threshold as Ripple bulls fail to show up.
Jito price could hit $6 as JTO coils up inside this bullish pattern
Jito price action shows a potential cup and handle formation. Based on theoretical measurement rules, a successful breakout could yield a 56% rally to $6.0. A breakdown of the $3.86 support level would create a lower low for JTO and invalidate the bullish thesis.
Bitcoin: BTC may have recovered, but is it out of the woods?
Bitcoin’s (BTC) upward momentum has shown a significant decline for the past two weeks or so. This development led to a bearish signal on the weekly and an uncertain outlook on the monthly.