Bitcoin Cash Price Analysis: BCH at the tipping point as reversal looms
- Bitcoin Cash majestic uptrend hits pause above $260, delaying recovery to $280.
- A reversal seems imminent, especially with the RSI out of the overbought and the sell signal on the daily chart.

Bitcoin Cash consistent rally since the beginning of October appears to be reaching its limit. The digital asset continued with the mission of breaking barriers even when Bitcoin, Ethereum and other digital assets stalled. At the moment, bulls are fixated on overcoming the seller congestion at $280. However, a reversal is anticipated in the coming sessions based on various technical indicators.
Grayscale sees "unprecedented demand" for Bitcoin Cash
This week, Grayscale Investment announced a record-breaking quarterly performance with inflows of over $1 billion. The company added that the year-to-date investment into various "products had surpassed $2.4 billion." Intriguingly, the firm has experienced "unprecedented demand for BCH, LTC and DLC." These products recorded over a 1,400% increase in inflows. The investment firm explained:
These developments followed FINRA's verification in July that the required diligence to begin quoting the Bitcoin Cash and Litecoin products … had been completed.
Bitcoin Cash reversal seems imminent
Bitcoin Cash is teetering at $263 at the time of writing. The crypto is still in the bulls' hands according to the gap created by the 50 Simple Moving Average above the 100 SMA in the 4-hour timeframe. However, the Relative Strength Index (RSI) was recently rejected from the overbought region, suggesting diminishing bullish momentum.
Anticipated gains to $280 could become a pipe dream if the rising wedge pattern breakdown materializes. This type of pattern is common in technical analysis and signal an impeding reversal from an extended uptrend. If the initial support at $260 fails to hold, the 50 SMA is the next target. However, buying pressure at $250 will absorb some of the selling pressure.
BCH/USD 4-hour chart
-637384182218420535.png)
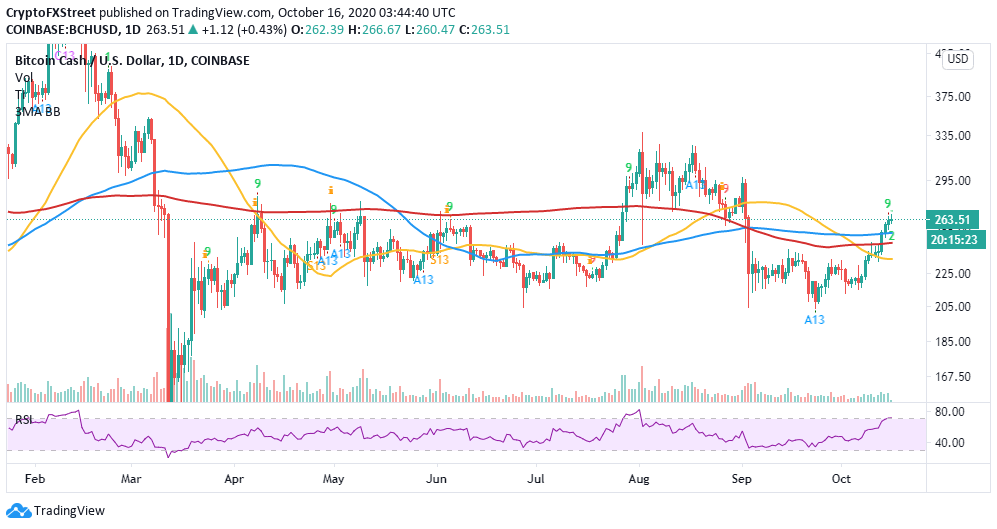
The TD Sequential Indicator recently presented a sell signal in the form of a green nine candlestick on the daily chart. This sell signal adds weight to the expected reversal. However, it is essential to realize that Bitcoin Cash is trading above the 100 SMA, 200 SMA and the 50 SMA. Therefore, declines may not be extreme, but if Bitcoin Cash misses the anchors at $250 and $245, the 50 SMA will come in handy at $235.
BCH/USD daily chart
IntoTheBlock's IOMAP model suggests that if BCH flips the resistance between $266 and $273 into support, gains to $280 will be easily achieved. The supply in this range is created by nearly 36,000 addresses that previously purchased roughly 370,000 BCH.
On the downside, increasing support, as illustrated by the model, will continue to hold Bitcoin Cash in place. However, intense selling pressure could force the crypto below the cluster of medium-strong resistances. The most robust support runs from $223 to $233; here, about 171,000 addresses previously purchased approximately 1.5 million BCH.
Bitcoin Cash IOMAP chart
-637384183683388013.png)
Looking at the other side of the fence
It is worth mentioning that the sell signal may be invalidated if Bitcoin Cash holds above short term support at $260 and resumes the uptrend past the resistance between $266 and $273. The 50-day SMA is also in line to offer support and may result in a bounce upwards. Besides, BCH could have stalled because of the lack of volatility, affecting even the larger assets like Bitcoin and Ethereum. Therefore, if volatility returns and volume grows, Bitcoin Cash may rush to $280.
Author

John Isige
FXStreet
John Isige is a seasoned cryptocurrency journalist and markets analyst committed to delivering high-quality, actionable insights tailored to traders, investors, and crypto enthusiasts. He enjoys deep dives into emerging Web3 tren


