Bitcoin Elliott Wave buying the dips at the blue box area

In this article we’re going to take a quick look at the Elliott Wave charts of Bitcoin BTCUSD published in members area of the website. As our members know BTCUSD is showing impulsive bullish sequences in the cycles from the 15,760 and 50,186 lows , that are calling for a further strength. Recently we got a pull back that has ended at the Blue Box zone,our buying area. In the further text we are going to explain the Elliott Wave Forecast and trading setup.
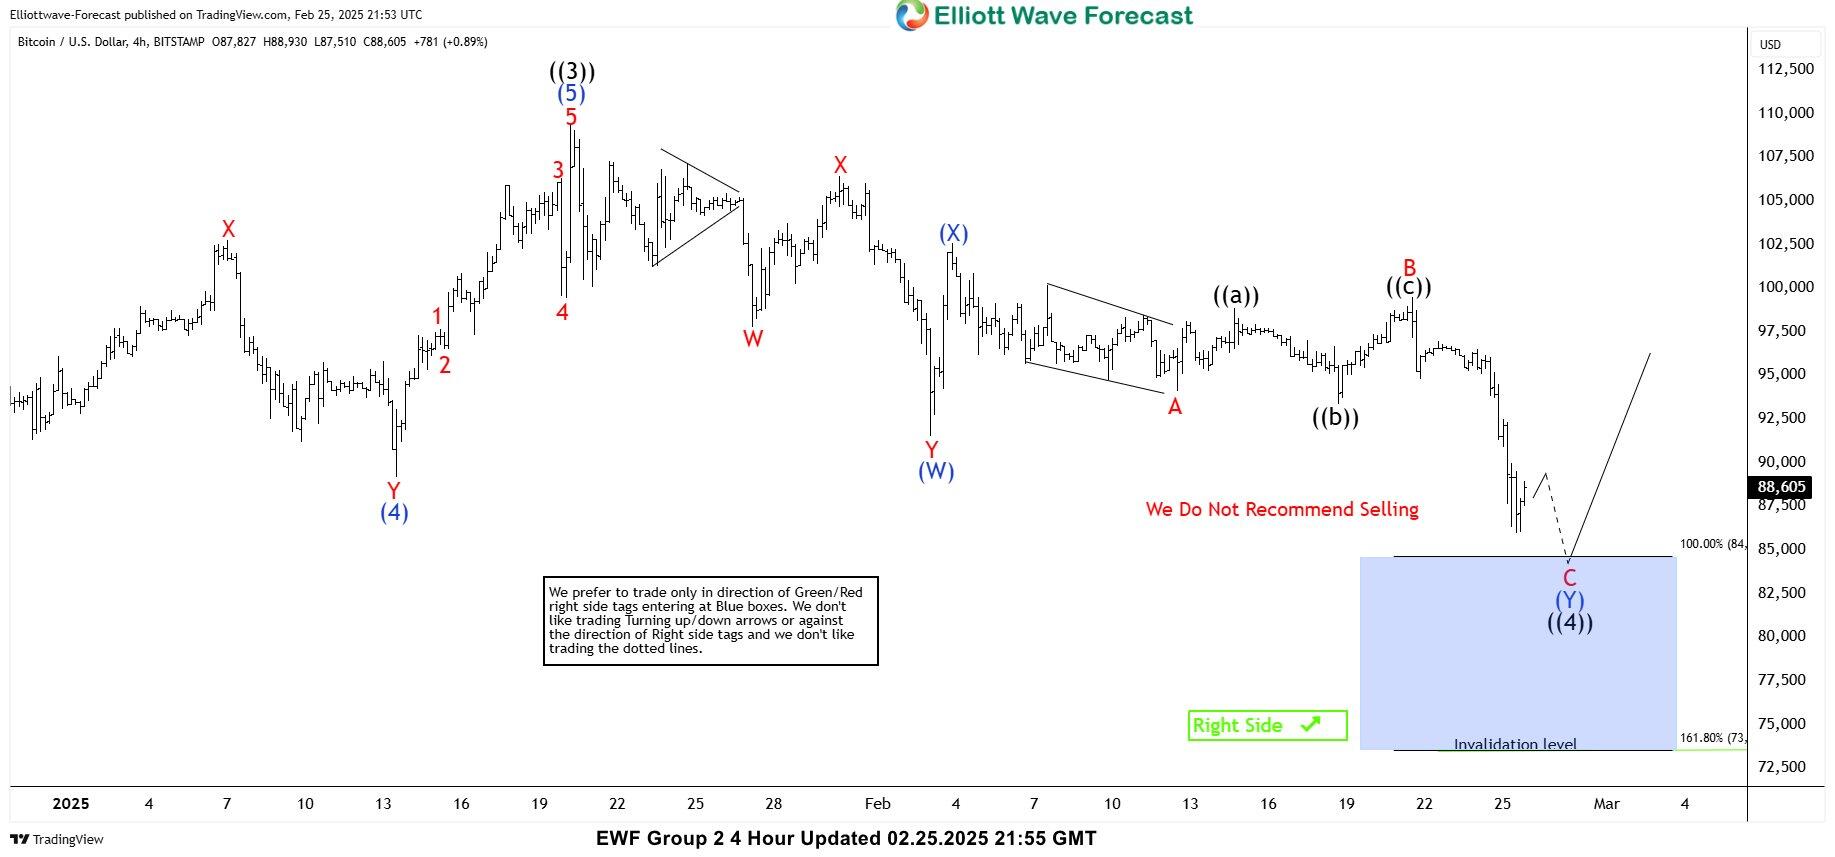
BTC/USD Elliott Wave four-hour chart 02.25.2025
BTCUSD is showing an incomplete structure from the all-time high on January 20th. The current Elliott Wave count suggests we should ideally see more downside in the short term, toward the 84,703–73,638 area -Blue Box (our buying zone). As the main trend is bullish, we expect to see at least a 3 waves bounce from the buying zone. Once the price reaches 50 Fibs against the (X) blue peak, we will book partial profits. This setup could ideally lead to a rally toward new highs. We advise against selling and prefer the long side from the marked blue box (buying zone).
Quick reminder on how to trade our charts:
Red bearish stamp+ blue box = Selling Setup
Green bullish stamp+ blue box = Buying Setup
Charts with Black stamps are not tradable.
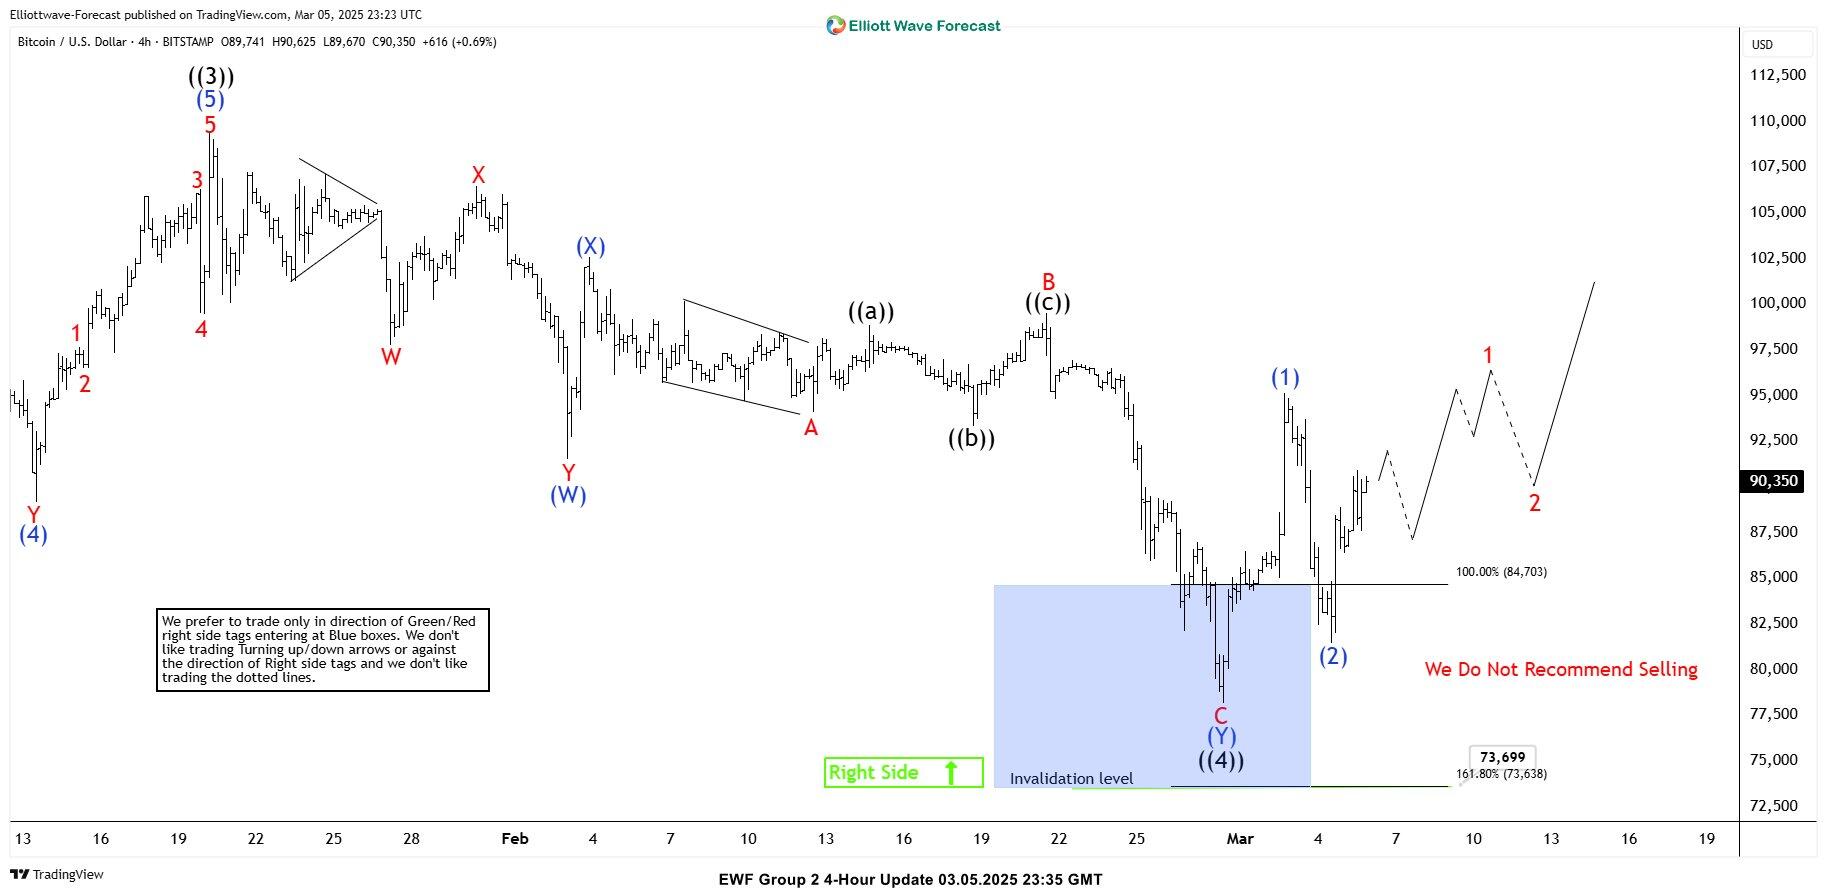
BTCUSD Elliott Wave four-hour chart 03.05.2025
BTCUSD made an extension toward our buying zone: 84,703–73,638. The crypto found buyers at the Blue Box as expected, and we got a good reaction from there. As a result, traders who entered long positions are now enjoying risk-free profits. With the price holding above the 78,197 low, we expect further strength to follow. Next technical area to the upside comes at 98,258-102,052.
Author

Elliott Wave Forecast Team
ElliottWave-Forecast.com


