Bitcoin and Ethereum price prediction for today: BTC/USD key level at $10.600, ETH/USD looking at $740
- Bitcoin and Ethereum are trading in a compression scenario, trapped between important supports and a bunch of moving averages
- Low trend levels and the compression scenario increase the chances of a sudden spike of volatility when the current scenario vanishes

The factors that are tightening the ranges in Bitcoin, Ethereum and other Cryptos keep increasing. The main two Cryptocurrencies are trapped between vital supports to keep bullish hopes alive in the mid-term and some short-term moving averages that don't leave much room for price movements.
BTC/USD 1H chart
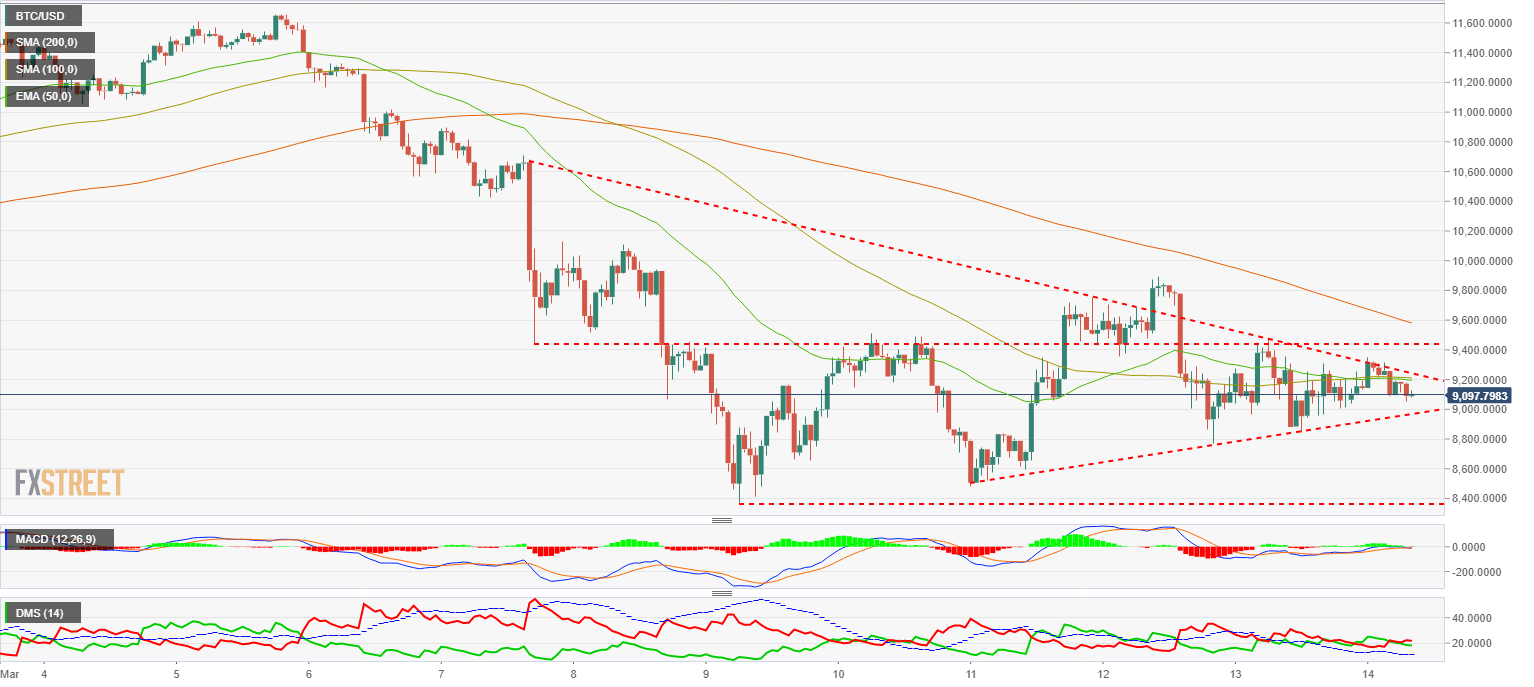
BTC/USD is trading around $9100 to start the European morning, right around a technical landscape that contains the price between barriers on both sides. This is a typical scenario when volatility is diminishing progressively. Bitcoin price is inside a triangular formation, inside a range between $10600 and $8400 that has been respected since last March 7th.
Moving averages have been closing on the price in the 1-hour charts and are now stuck to it, making any price movement very difficult.
On the upside, the 100-SMA is at $9198, followed by the 50-EMA at $9213. Just above there, at $9242, we can find a trendline that comes from last March 7th. The 200-SMA is now set at $9600 and just above that level will the BTC/USD be able to make an up-move with room to grow.
On the downside, immediate support is at $8950, and if that is not respected it will take the price immediately back to $8930, the range low.
MACD in the Bitcoin 1-hour chart is trading just above the neutral line, with a horizontal profile that indicates the price compression during the last sessions. The indicator doesn't bring much more information now.
Directional Movement Index shows an ADX at lows, confirming the lack of trend strength. A slight edge for the sellers, but it doesn't seem important if the directionality doesn't pick up.
ETH/USD 1H chart
 (1)-636566188028940333.png)
The Ethereum 1-hour chart is another example of the price compression and low volatility. ETH price has been locked in a range between $640 and $740 since last March 9th. This range, bigger than 10%, would be meaningful in any traditional asset, but in the Crypto sphere looks like a paltry one.
ETH/USD has multiple supports, the first one just below the current price, at $686. That is followed by other key levels at $680 and $660. If that level surrendered, the last one would be found at $640.
On the upside, it's again the 100-SMA and the 50-EMA the ones setting resistances at $704 and $697 each one. If Ethereum was able to break above these barriers, next meaningful level would be the 200-SMA at $730.
MACD in the Ethereum 1-hour chart is trading in the same situation than the Bitcoin one, moving a bit below the equilibrium line. There's not many more information about the trend in the upcoming periods.
Directional Movement Index is also showing an ADX at lows, with a certain recovery in the last hour. The D+ and D- indicators show the edge for the sellers over the buyers.
Author

Tomas Salles
FXStreet
Tomàs Sallés was born in Barcelona in 1972, he is a certified technical analyst after having completing specialized courses in Spain and Switzerland.


