Bitcoin, altcoins Christmas stall

The crypto sector has been moving slightly bearish since last Monday, erasing the gains made on Sunday 22. Bitcoin and Ethereum lost somewhat above 1%. Bitcoin Cash (-2.56%) Litecoin(2.06%) and Tron (-3.71%) suffered higher selling pressure, and Tezos( -8%) and Dash (-7%) were the worst performers. In the Ethereum token sector, HEDG (+4.87%) and MOF(4-15%) were the best performers among the top capitalized, whereas CENNZ (-7.25%) was the worst one.
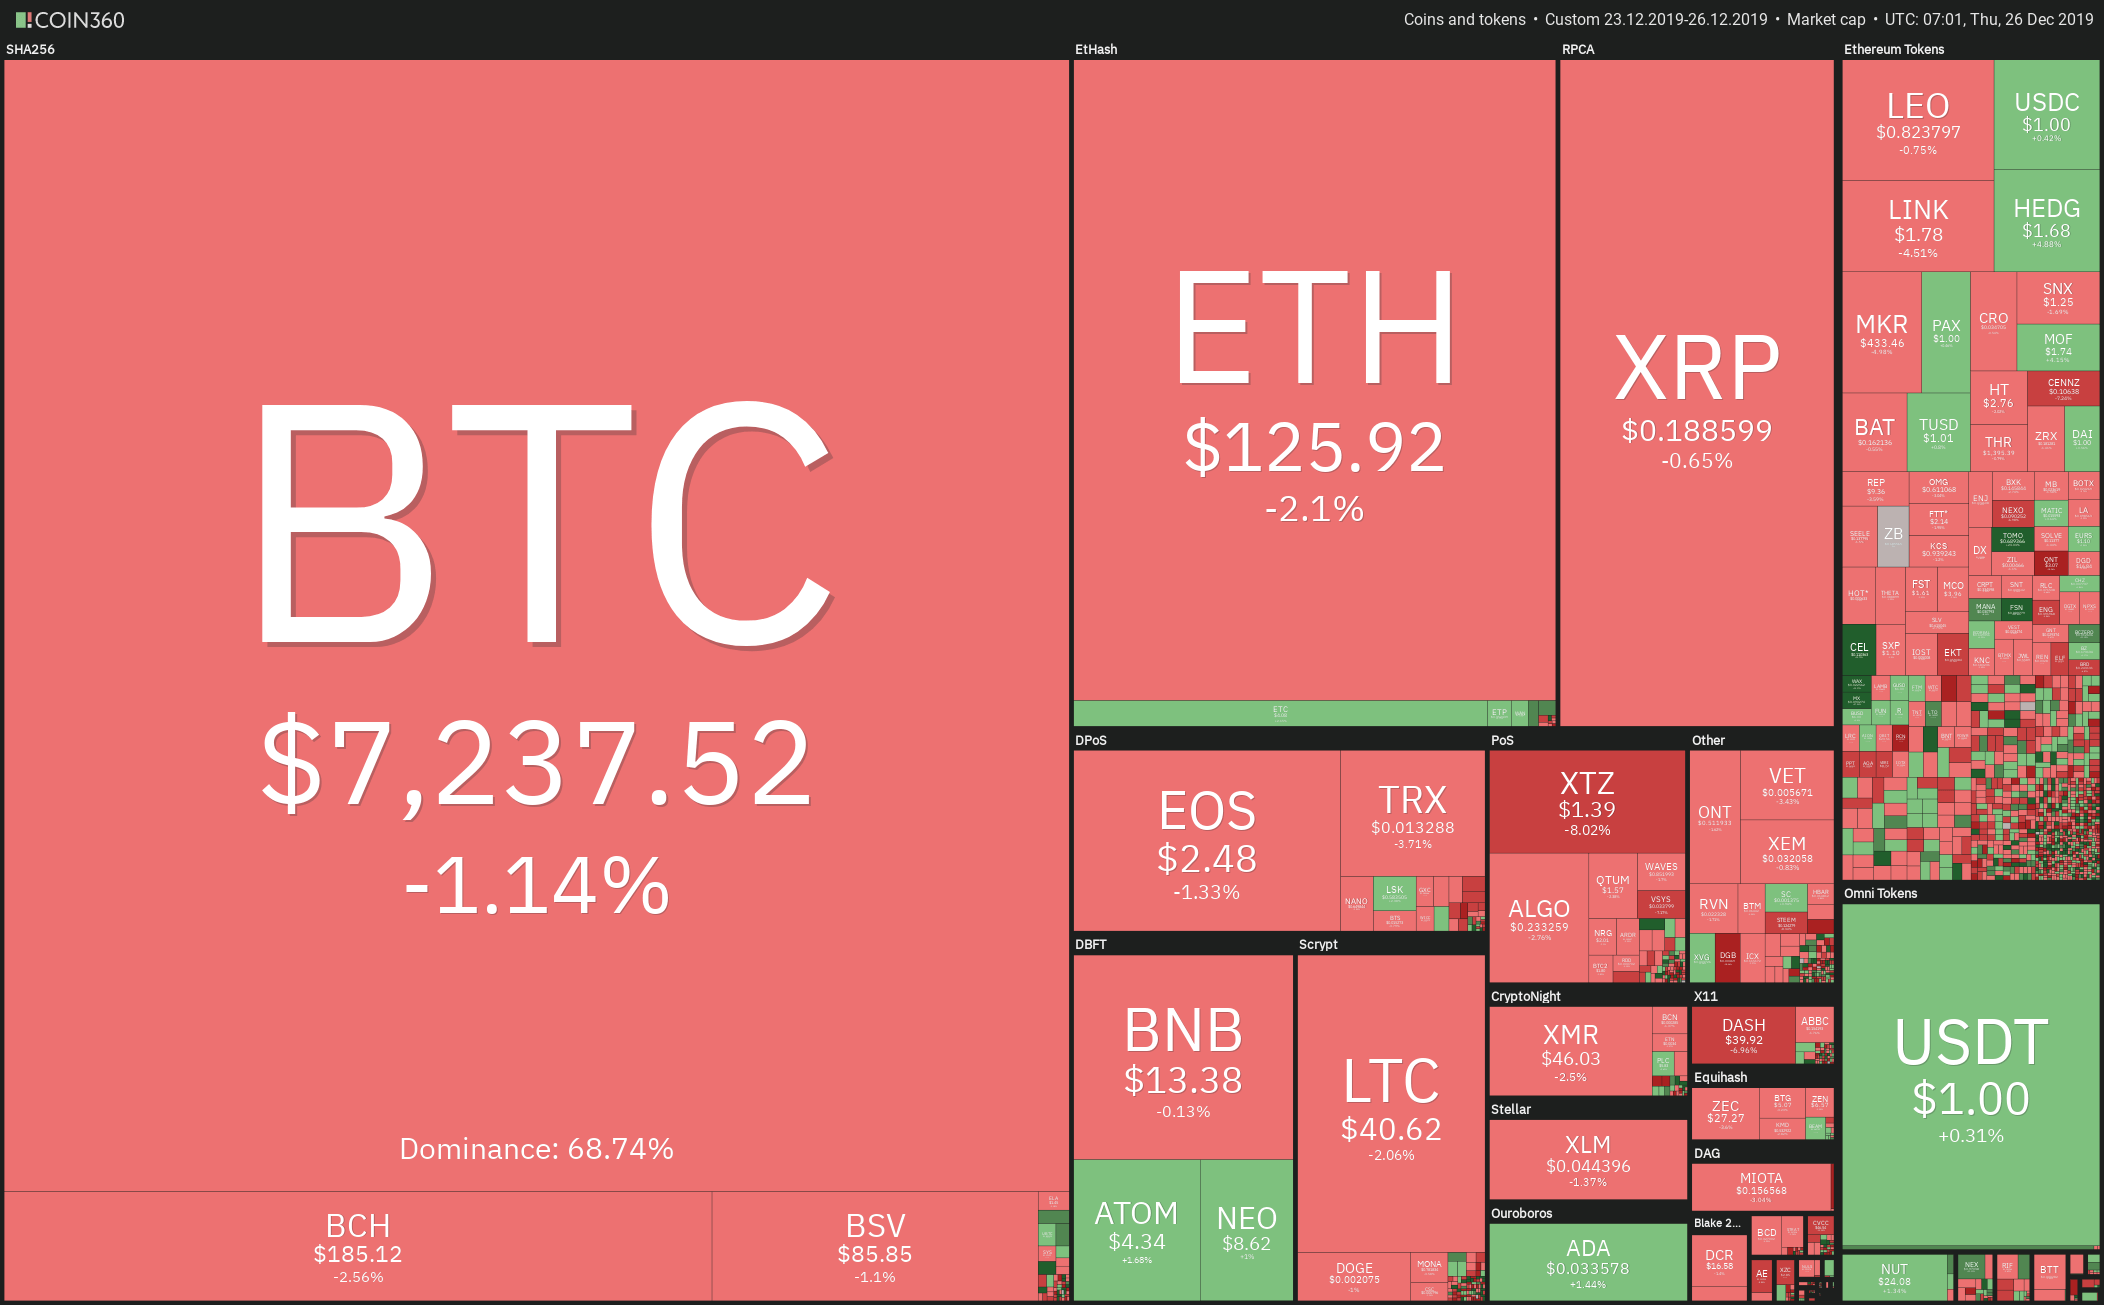
Fig 1 - Crypto Market Heat Map
The market capitalization of the sector is currently $191.132, $3 Billion (1.55%) below Tuesday's value. That was made on a 24H volume of $19.96 billion. Finally, the market capitalization of Bitcoin is 68.48%.
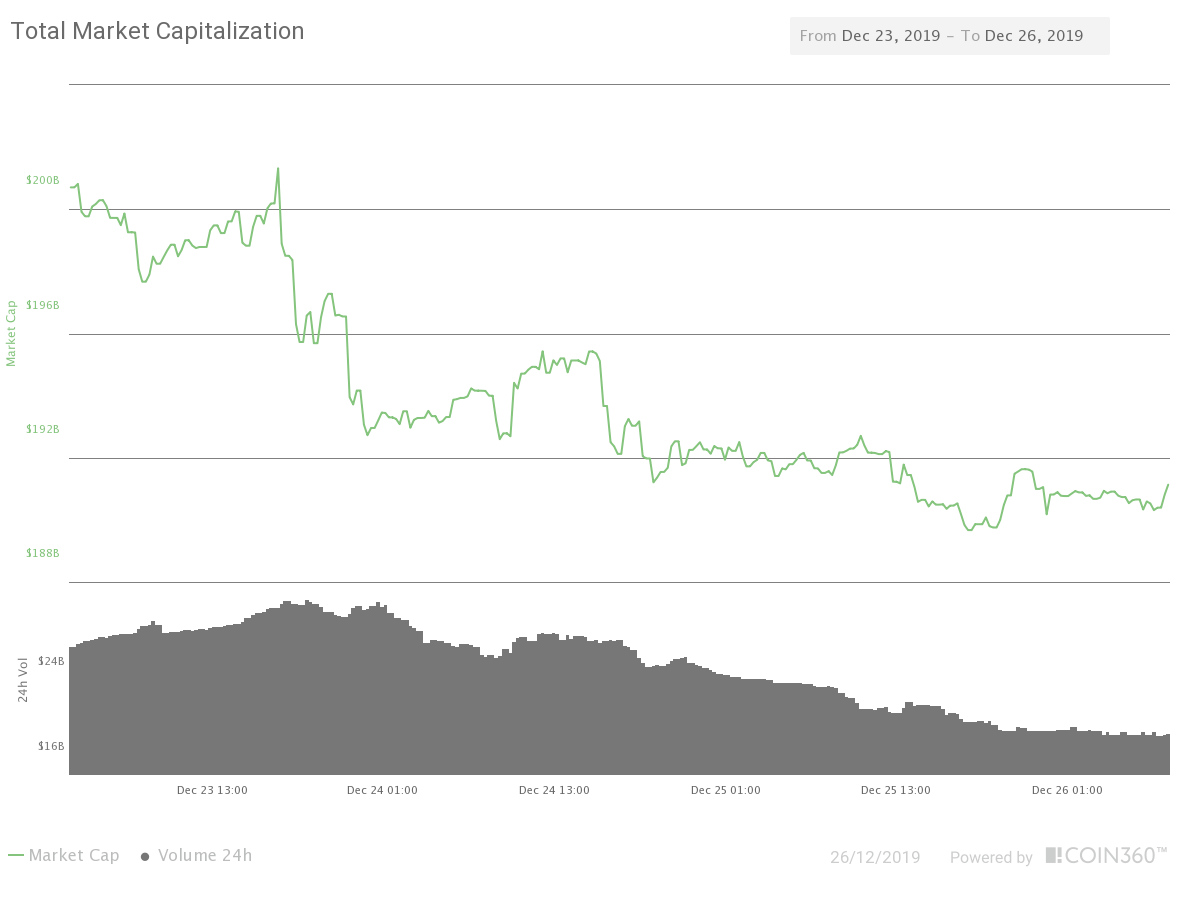
Fig 2 72H Market Capitalization and Traded Volume
Hot News
Some sources talk about China considering bitcoin and other cryptocurrencies in their reform of the foreign exchange markets, as part of their effort to push blockchain technology. One of the rumors is that China is considering creating a central bank for digital currencies, a strange concept if we consider that the current cryptocurrencies use a distributed ledger.
Technical Analysis
Bitcoin
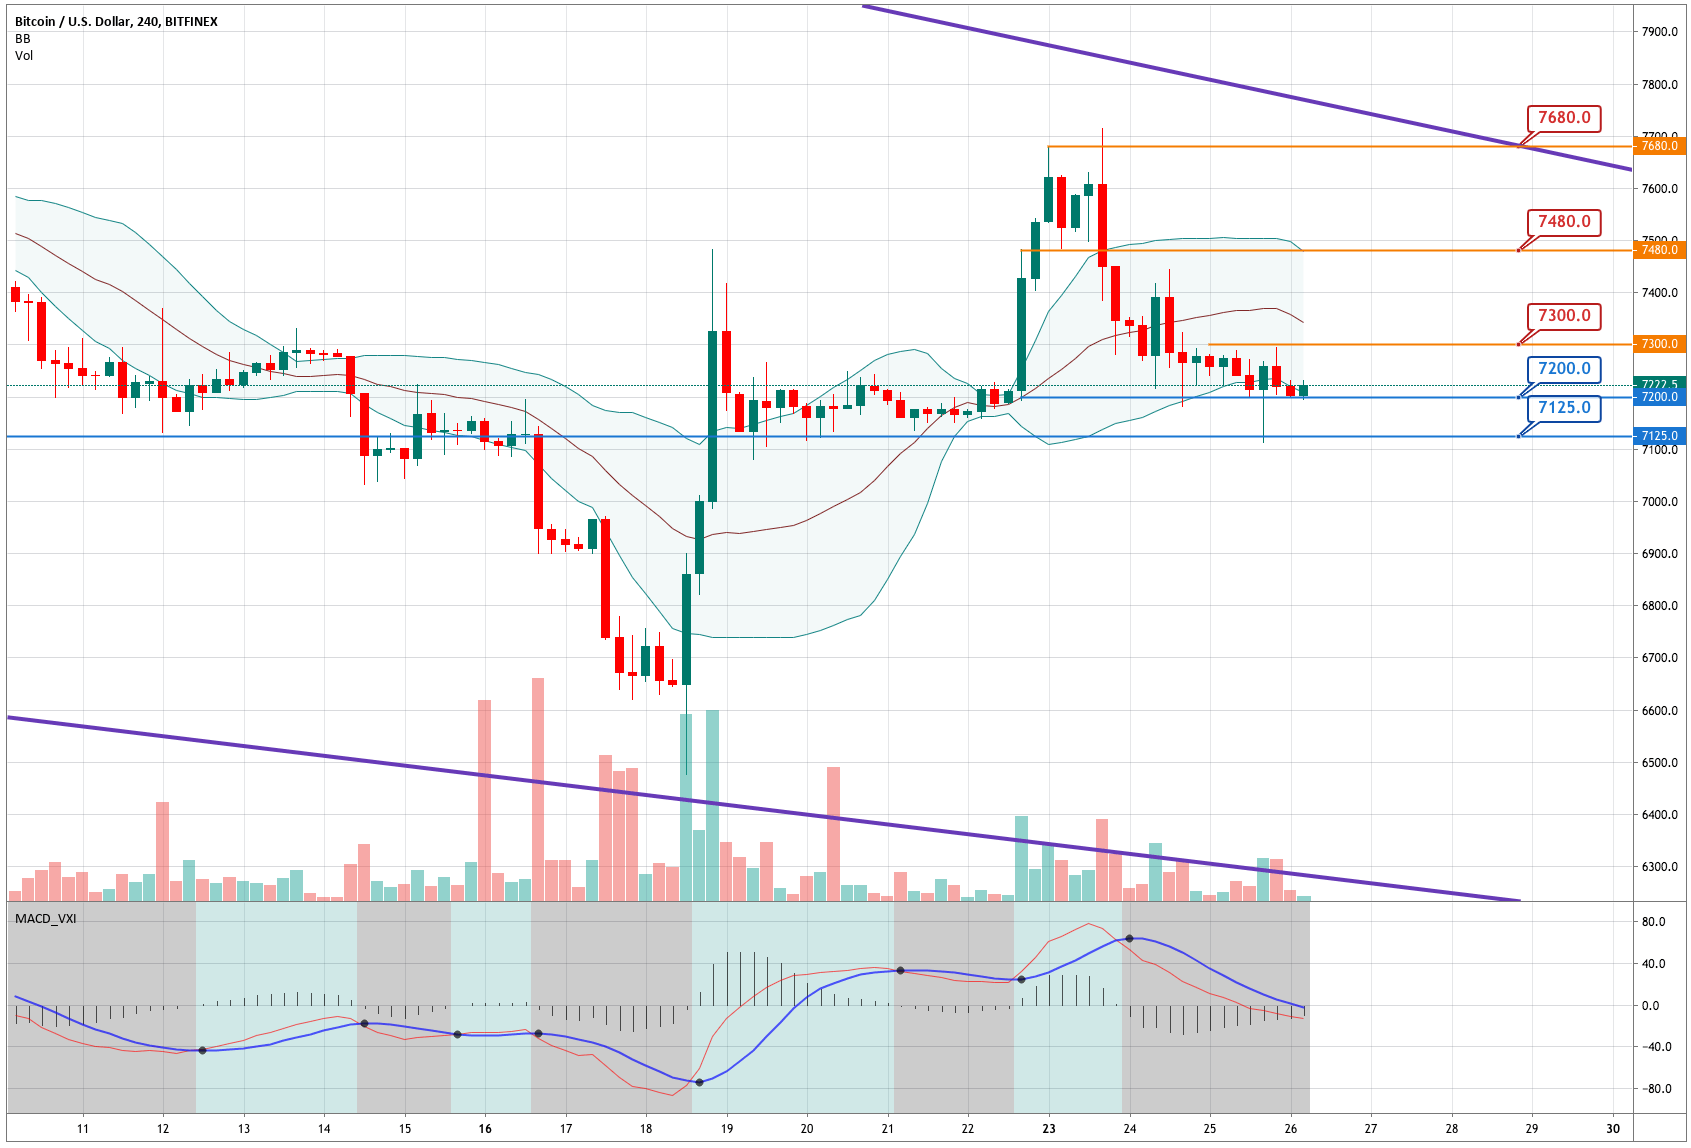
Chart 1- Bitcoin 4H Chart
Bitcoin has been descending slightly in the last 24 hours. Right now, BTC's price is near its $7200 support. Therefore the price action since Monday has erased 100 percent of the bullish impulse made on Sunday 22. The MACD moves in a bearish phase, with its histogram ascending slightly. Also, the price has shifted to the -1SD line, therefore the current price situation is slightly bearish. The most crucial level to keep is $7,125, while a close above $7,300 would attract the buyers.
|
SUPPORT |
PIVOT POINT |
RESISTANCE |
|
7,125 |
7,200 |
7,300 |
|
7,026 |
7,390 | |
|
7,944 |
7,480 |
Ripple
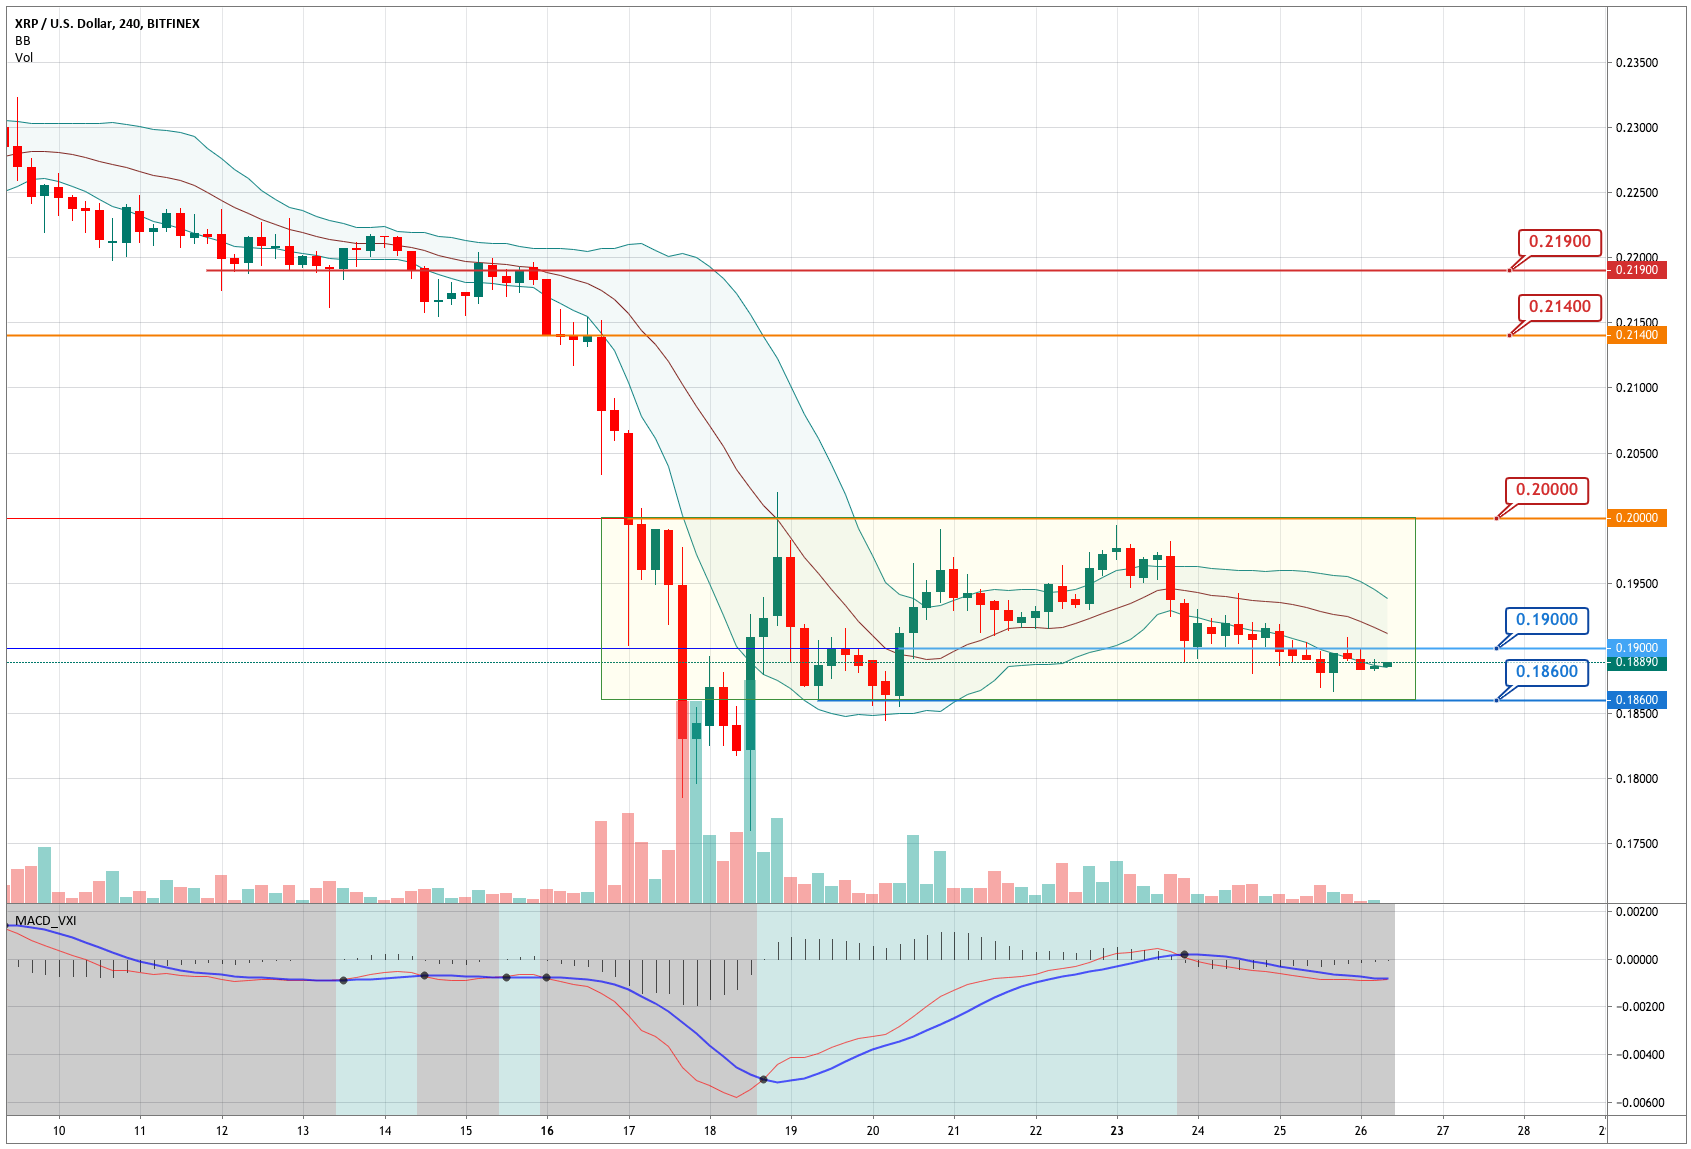
Chart 2 - RIpple 4H Chart
Ethereum has been descending slightly since our last Dec 24 report. The price is following the path marked by its -1SD Bollinger line and currently moves between $0.19 and $ 0.186. This kind of movement is consistent with a sideways channel between $0.186 and $0.20.
The MACD is close to making a bullish transition. So, if the price breaks $0.19 with strength, we could think a new leg up has started, with a potential target at $0.20.
|
SUPPORT |
PIVOT POINT |
RESISTANCE |
|
0.1866 |
0.19 |
0.192 |
|
0.184 |
0.194 | |
|
0.181 |
0.197 |
Ethereum
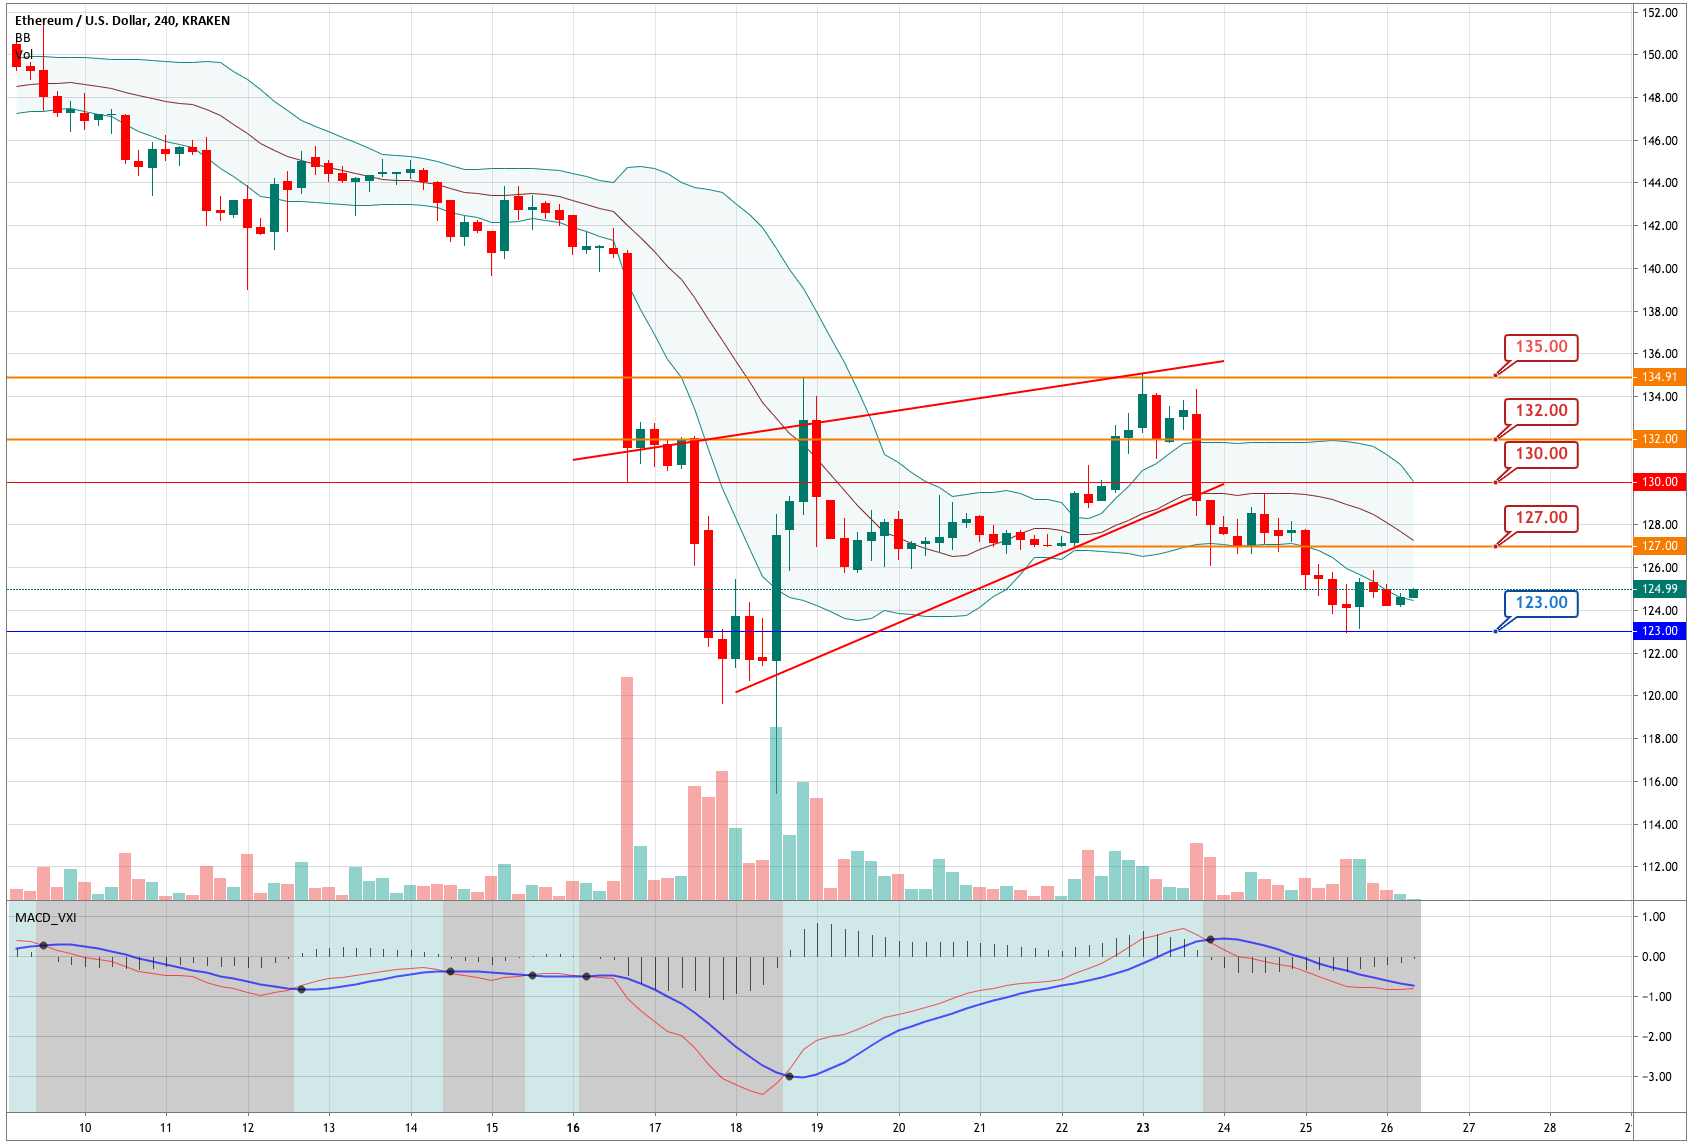
Chart 3 - Ethereum 4H Chart
Ethereum dropped to $123 in the last few hours, where it found the strength to bounce off. The MACD is also close to making a bullish transition, while the price seems to have ended its falls. We need to see strength on the price action to consider that a new leg up has started. The level to think of a bullish scenario is a close above $127.
|
SUPPORT |
PIVOT POINT |
RESISTANCE |
|
123 |
125 |
127 |
|
120 |
130 | |
|
118 |
132 |
Litecoin
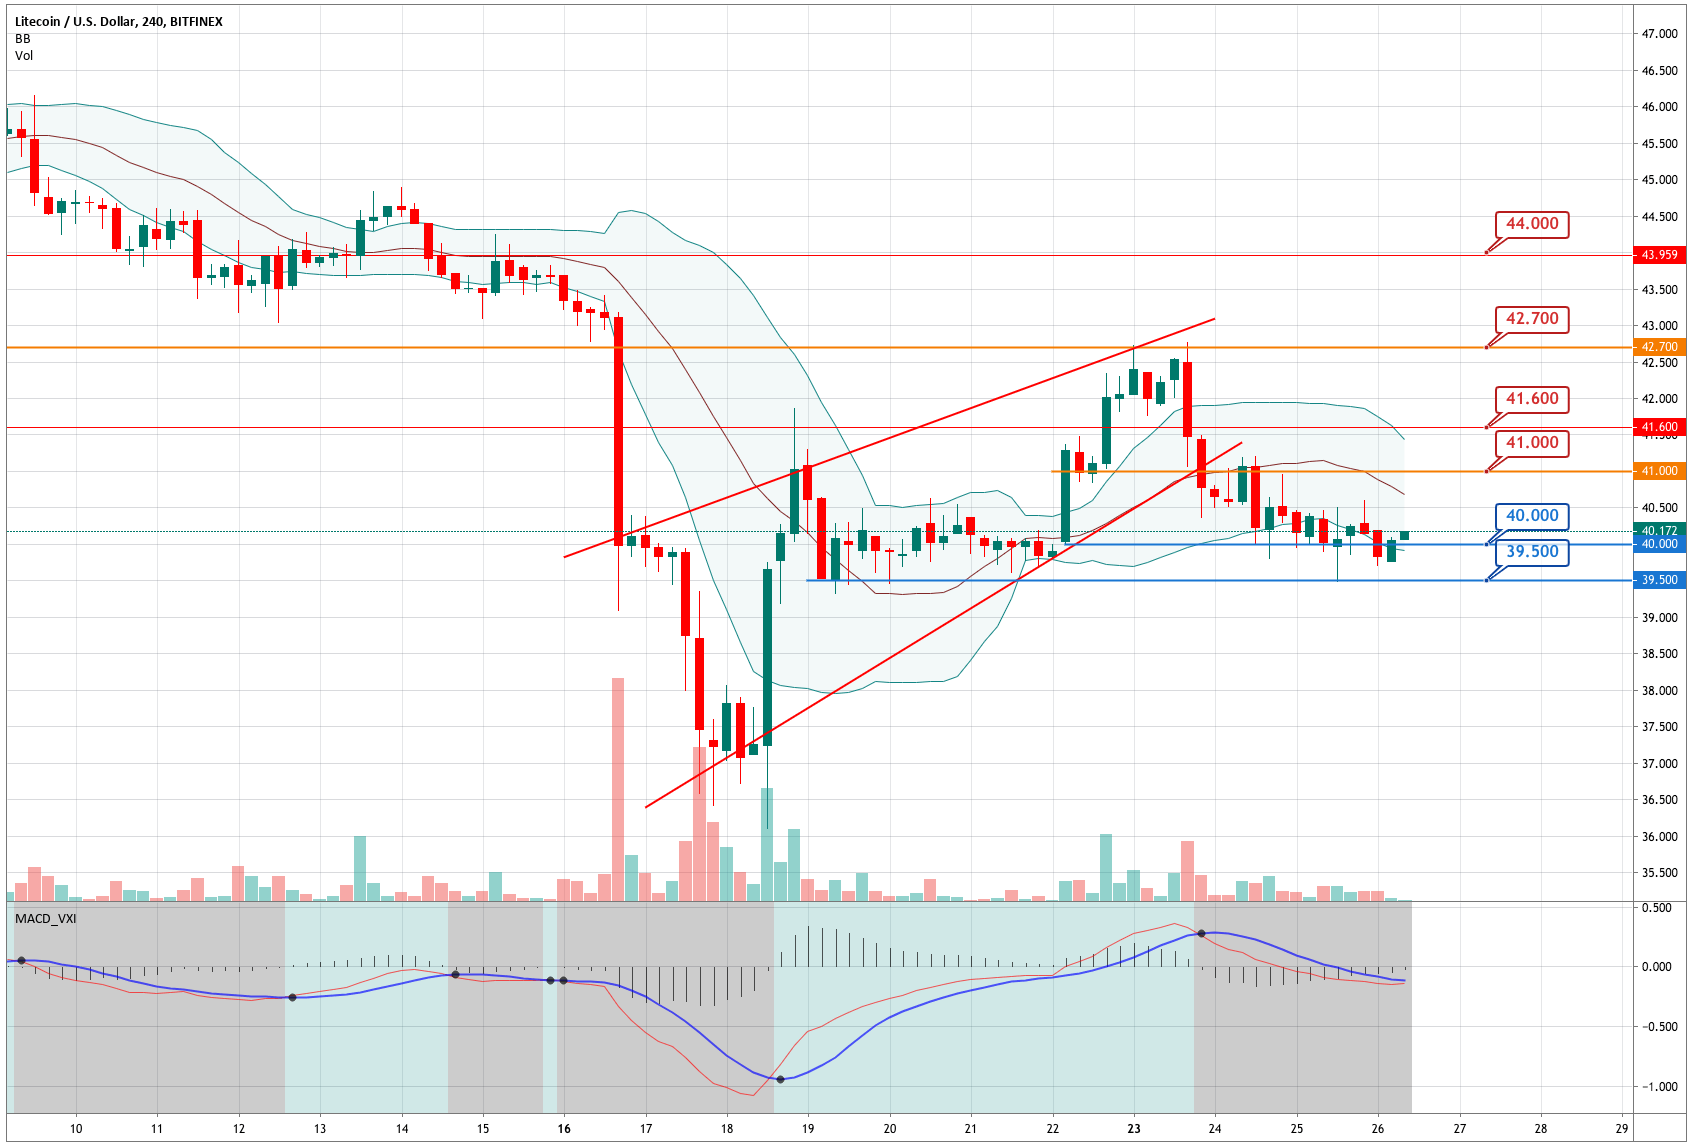
Chart 4 - Litecoin 4H Chart
Litecoin is making a kind of sideways action after breaking the ascending wedge to the downside on Monday. The price moves in the support area of $40, and the MACD seems close to a bullish transition. A break above $41 would be perfect to attract the buyers back. A break below $39.5 would accelerate sales.
|
SUPPORT |
PIVOT POINT |
RESISTANCE |
|
39.5 |
40 |
40.6 |
|
39 |
41.2 | |
|
38.5 |
41.7 |
Author

EagleFX Team
EagleFX
EagleFX Team is an international group of market analysts with skills in fundamental and technical analysis, applying several methods to assess the state and likelihood of price movements on Forex, Commodities, Indices, Metals and


