Bitcoin, Altcoins, Bouncing off of their Lows

In the last 24 hours, the cryptocurrency markets are bouncing off of their supports. After a relatively synchronized selloff, the prices went to extreme oversold levels, which currently are backtracking. Bitcoin (-0.33%) and Ethereum (+0.42%) are relatively flat against their previous 24H value, XRP(+1-5%) is a bit more positive, while NEO and NANO jump over 5%. The Ethereum token industry is currently mixed. Among top tiers, HEDG(+5.8%), ZRX (+8.3%), REP (+12%), and SNX (+14.7%) are the best performers. Worth mentioning also SEELE (+18%) and CRPT( +24.3%).
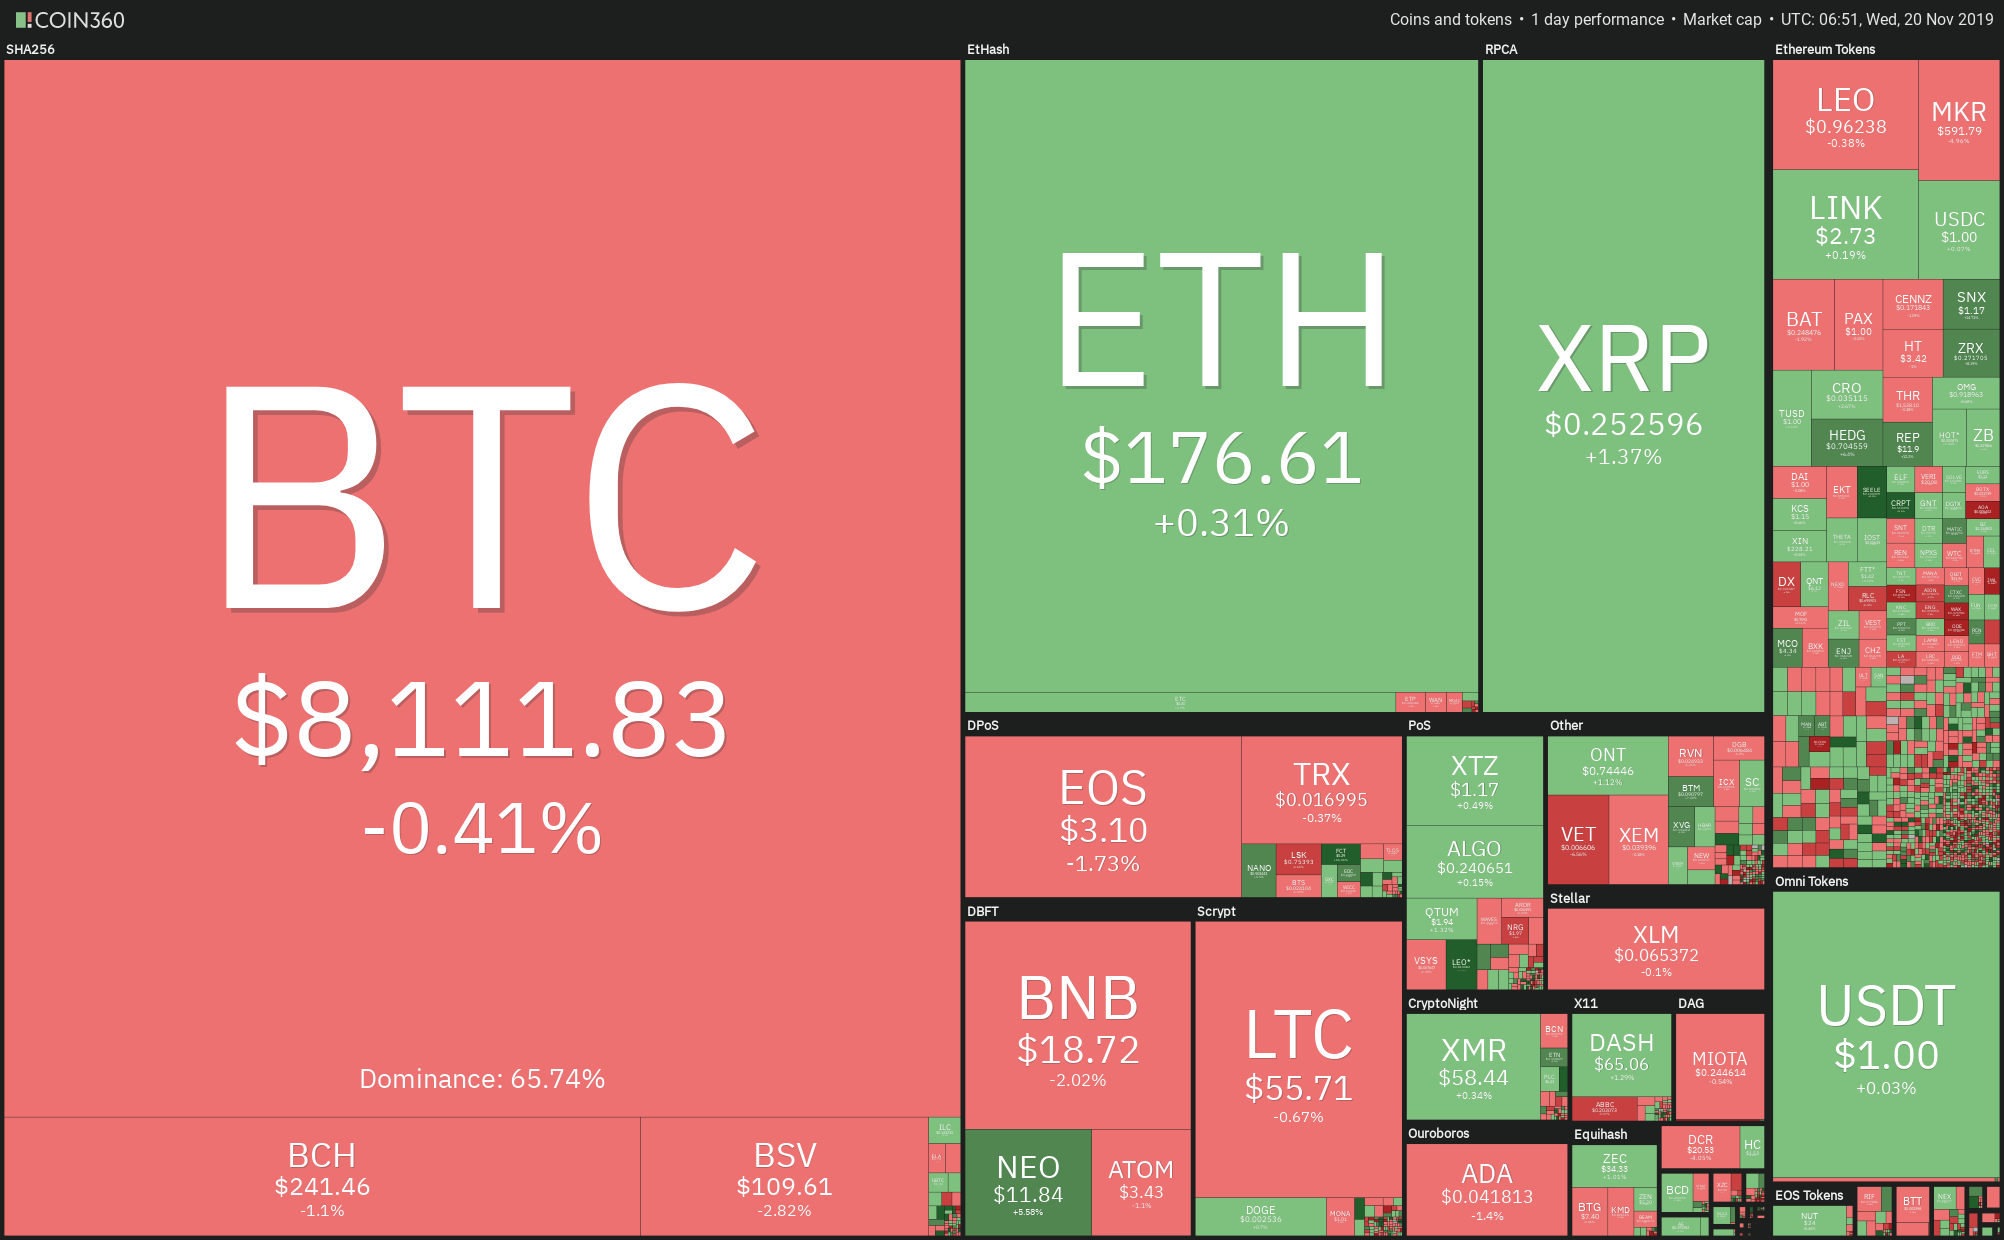
Fig 1 - 24H Crypto Sector Heat Map
The current market capitalization of the sector is $222.817 billion, a 0.83% drop, while the traded volume in the last 24 hours is $276.9 billion, a 9% drop. Finally, the domination of the Bitcoin descended to 65.69%.
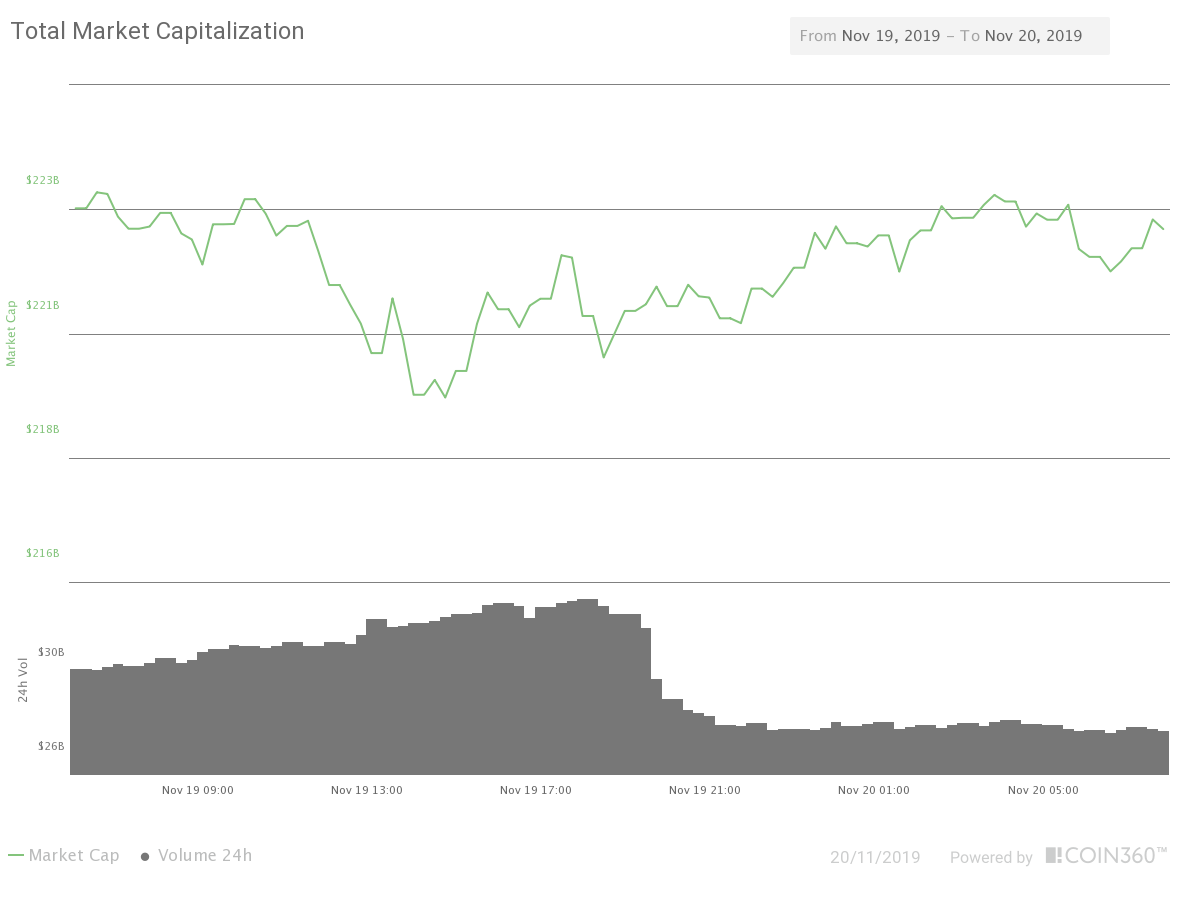
Fig 2 - 24H Crypto Market Cap and traded volume
Hot News
Fidielity Digital Asset Services LLC has been granted a charter for its crypto-related services. FDAS joined another 22 other companies who have been permitted to engage in the digital currency business.
Thailand will host the 14th World Blockchain Summit this December. The summit will take place on the 1st and 2nd of December at the Intercontinental Bangkok.
US FEMA advisory board is considering DLT technology-powered registry to accelerate the process of payments in disaster relief programs. This proposal was included in a report by the National Advisory Council (NAC) released on November 18.
Technical Analysis - Bitcoin
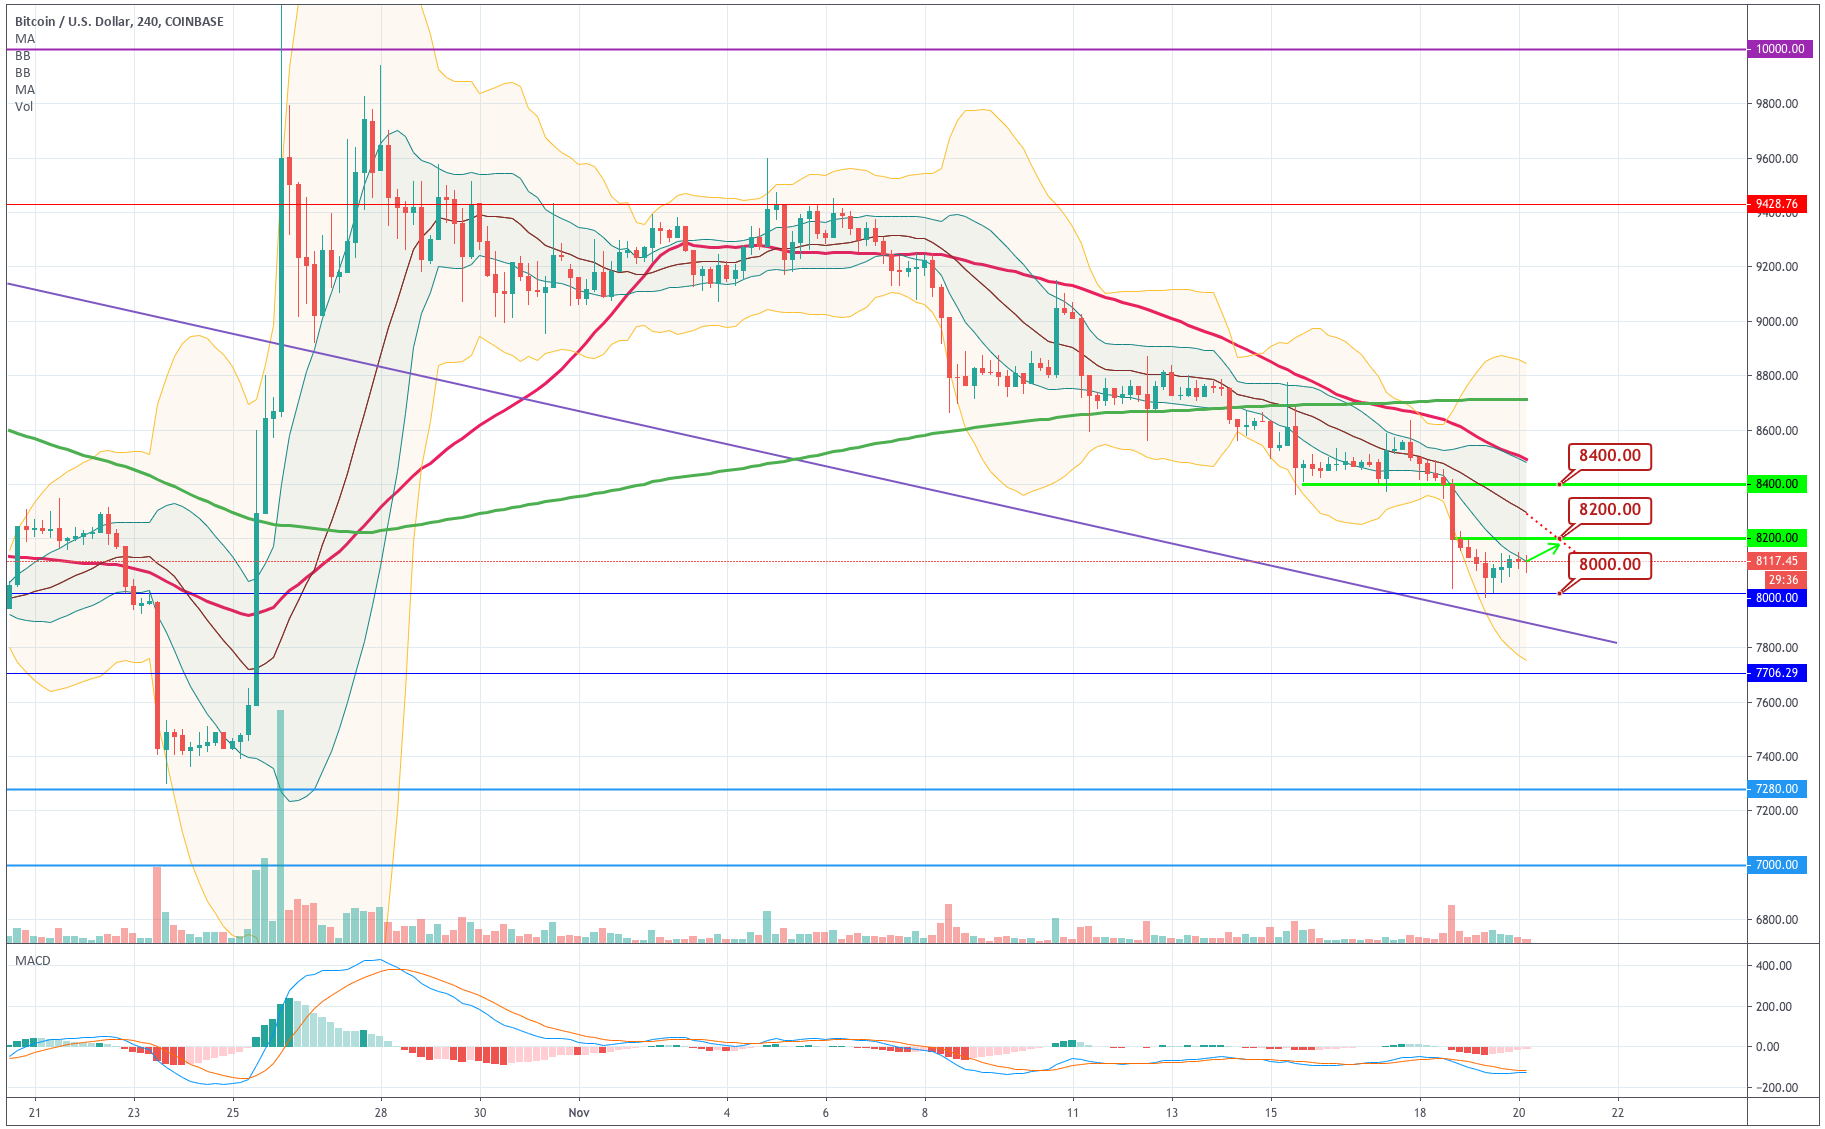
Chart 1 Bitcoin 4H Chart
Bitcoin is moving of its lows, after a harami (inside bar), which also made a kind of double bottom on the $8,000 level. We can see on the chart that this double bottom was made with two candlesticks with relatively large lower wicks near the -3SD Bollinger line (amber). This pattern is relatively frequent, and the posterior evolution of the action usually carries the price to the surroundings of the Bollinger Mean line. But that pattern is a continuation pattern. Therefore, until new developments, we must assume the downward path to continue. $8,200 is the resistance to break, while $8,000 the support to keep.
| Supports | Pivot | Resistances |
| 8000 | 8,098 | 8218 |
| 7880 | 8318 | |
| 7780 | 8440 |
Ripple
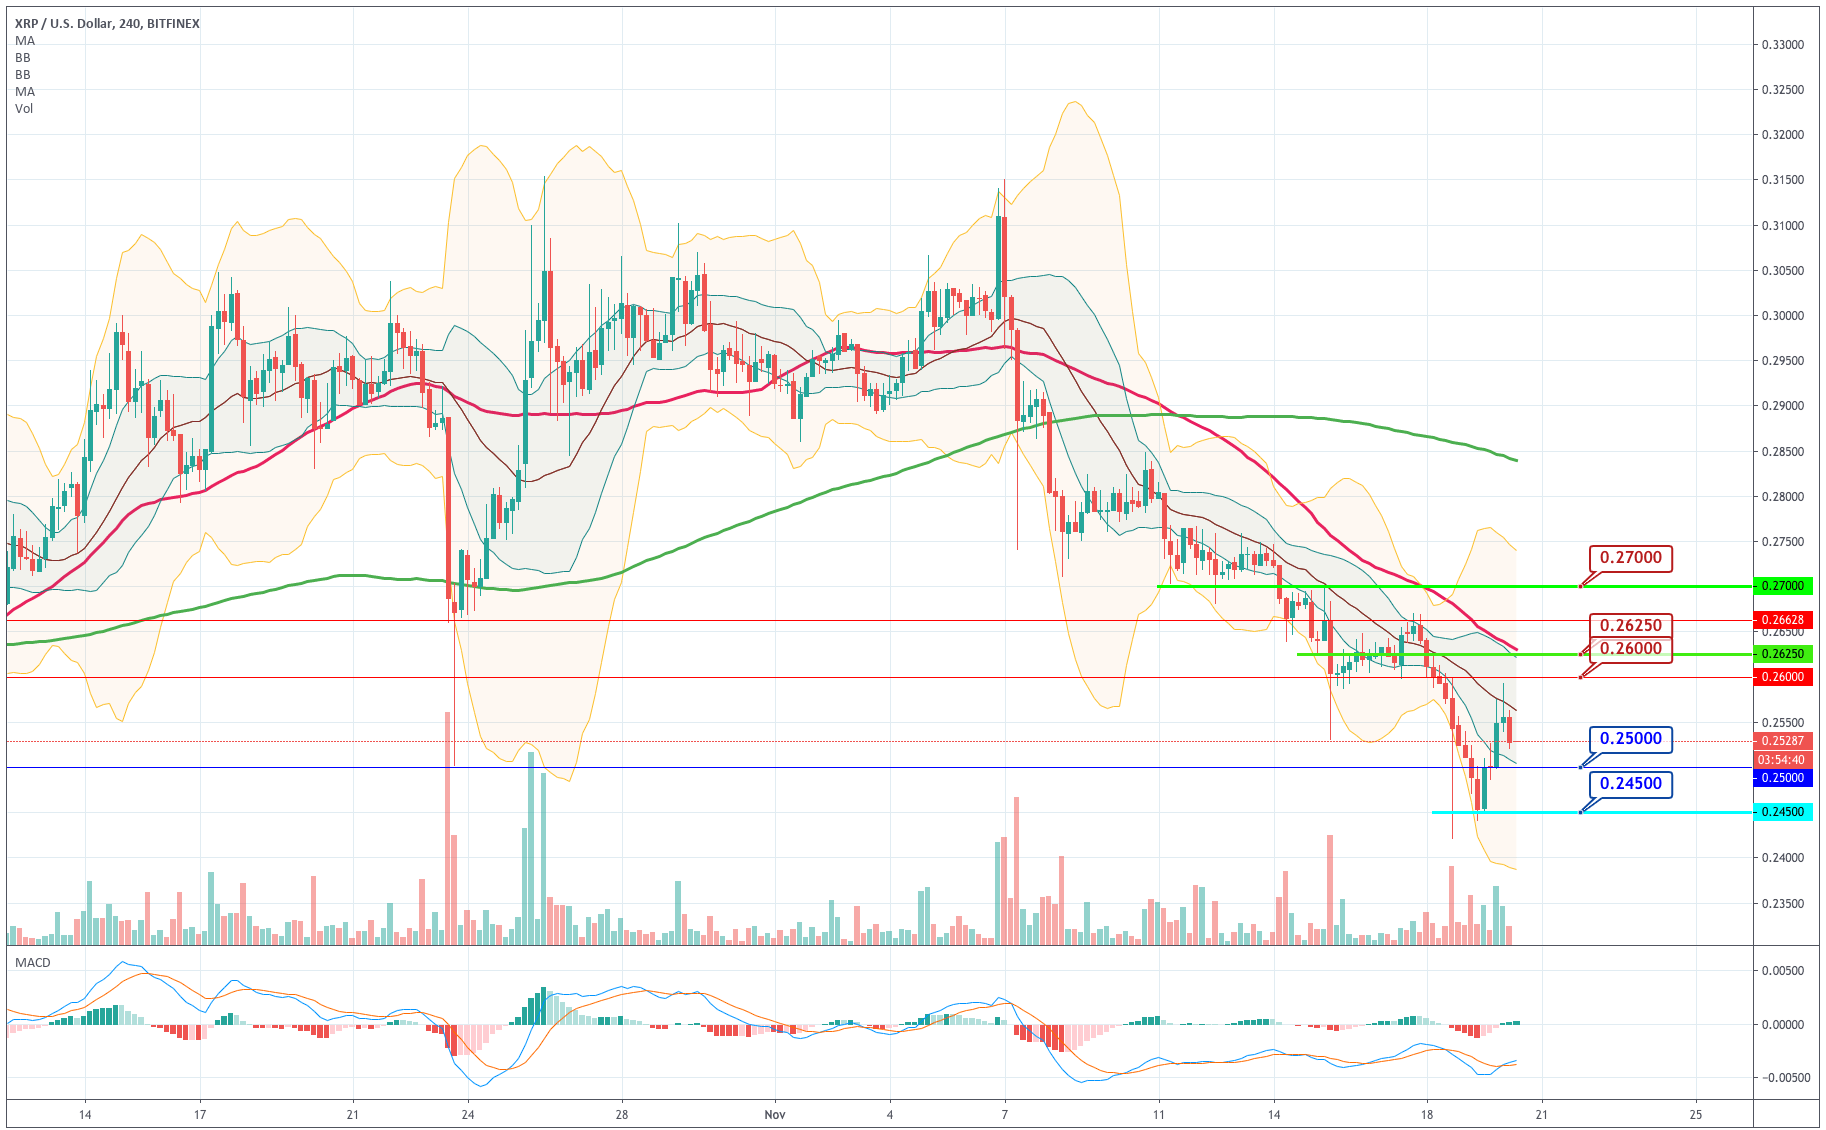
Chart 2 - Ripple 4 Chart
Ripple made a reversal candle yesterday noon, which gave the impulse for the asset to cross the %0.25 level to the upside with increasing volume. After being rejected by the $0.26 level ( and the mid-Bollinger line), the price is making a weak figure. The overall trend continues to be bearish as all averages have a negative slope, and the price keeps moving in the lower side of the Bollinger bands. The main levels to keep watching are $0.25 and $0.245.
| Supports | Pivot | Resistances |
| 0.247 | 0.252 | 0.26 |
| 0.239 | 0.267 | |
| 0.233 | 0.27 |
Ethereum
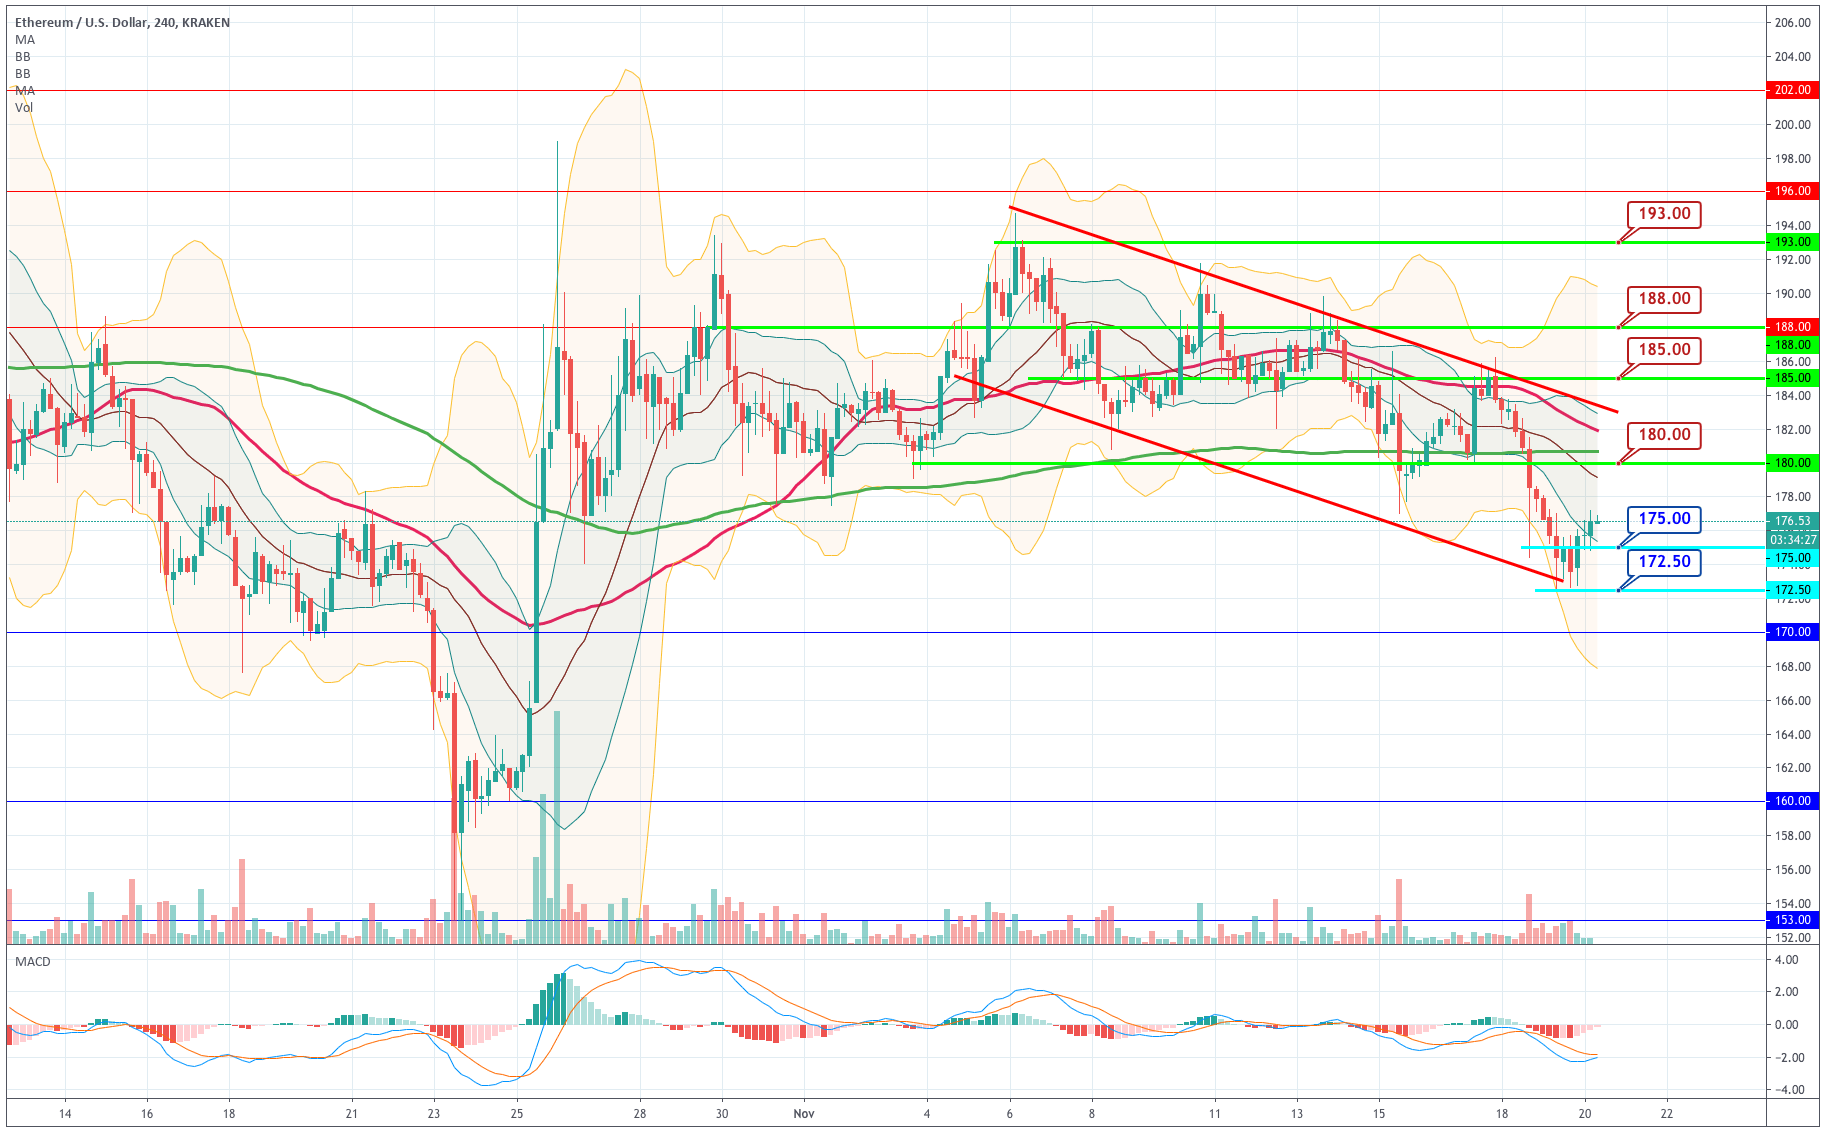
Chart 3 - Ethereum 4H Chart
The recent price action of Ethereum has created a descending channel. On Tuesday, the price made a kind of multiple bottoms with a final reversal pattern, an engulfing candle that drove the price above $175. The bottoming happened near the -3SD Bollinger line ( which marks oversold levels) and creates the pattern described in our Bitcoin analysis. The price moves towards the mid-Bollinger line, which is also close to the center of the channel. The issue here is if the price will continue upwards towards the top of this channel or the bearishness is resuming. The current market situation seems to indicate this is just a momentary bounce.
The levels to watch are mainly $175 and $172 to the downside and $180 to the upside.
| Supports | Pivot | Resistances |
| 172.5 | 175.4 | 178 |
| 170 | 181 | |
| 167 | 184 |
Litecoin
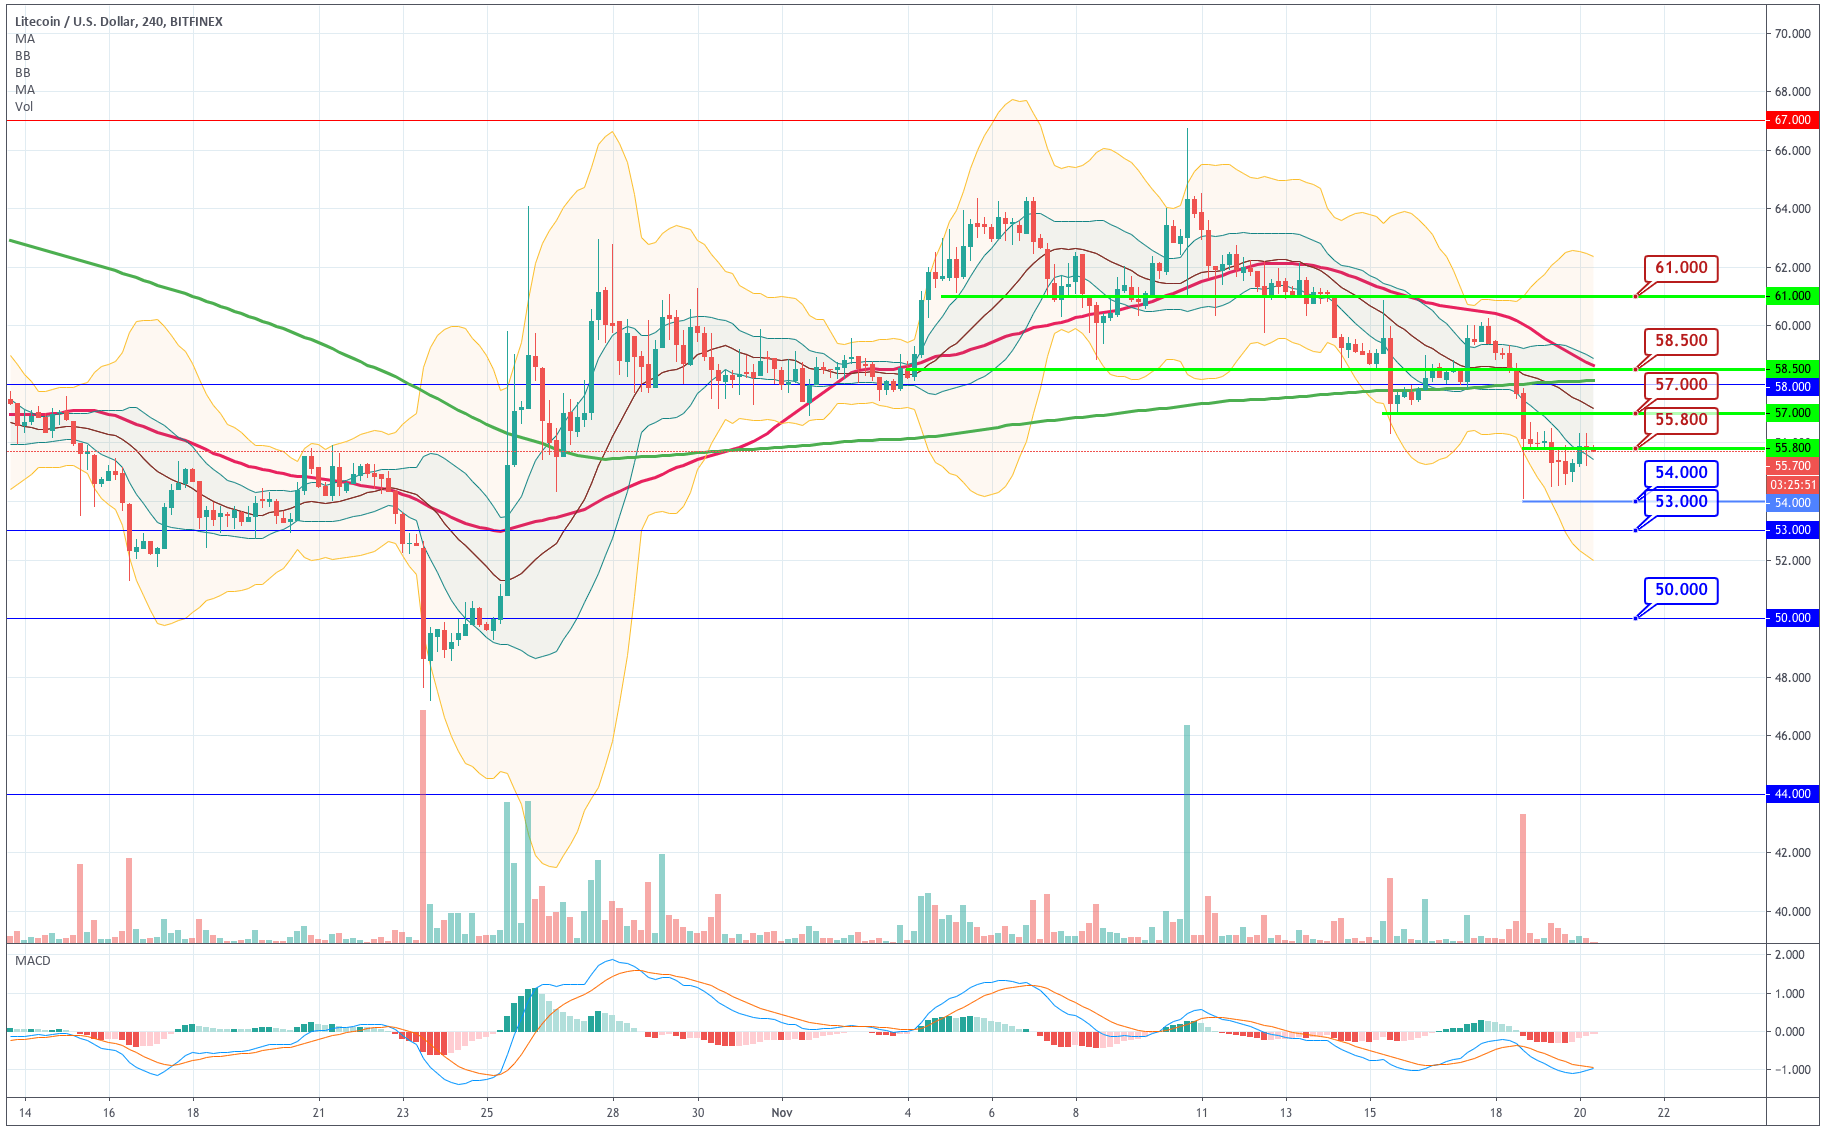
Chart 4 - Litecoin 4H Chart
Litecoin has bounced as the other cryptos analyzed today, but its bounce was minimal. The price is close to the -1SD Bollinger line and just fighting the $55.8 level, which acts as resistance. All indicate more downside. A bearish candle at this level could be enough to confirm a continuation of the trend.
| Supports | Pivot | Resistances |
| 54 | 55,4 | 56.5 |
| 53 | 57.5 | |
| 52.3 | 58.5 |
Author

EagleFX Team
EagleFX
EagleFX Team is an international group of market analysts with skills in fundamental and technical analysis, applying several methods to assess the state and likelihood of price movements on Forex, Commodities, Indices, Metals and


