Introduction
Statistical analysis is a popular tool used by traders around the globe.
It can differ from technical analysis in the sense that raw data is used other than that formed on a chart.
Often both are one and the same but, from time to time, the results and trading systems produce different results.
In this study, we will be looking at the price waves. Most markets move in waves as all different types of traders looks to trade over different time horizons.
Some may be buying short term, some long term, some taking profit and there are traders who could just be arbitraging.
On the daily price charts, this study will be looking at the waves made between 30th May 2019 and the present day (29th November 2019)
What do we classify as a price wave?
A wave is from peak to trough or trough to peak of a move.
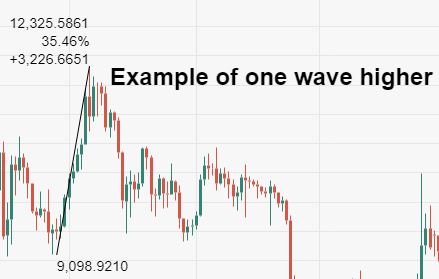
In the example below, we have measured one wave up. The wave saw the price increase 35.46% and $3,266.66.
In this study we will be measuring moves in USD as percentage changes can be relative depending on where price is at the time.
The measurement must be made from the wave low to high point or vice versa.
Raw results
Altogether there were 17 waves over the period measured and the biggest was a whopping $6441.44. The smallest price wave was $1125.
The average wave was $2810.25 in value.
The most common wave size was within a rage of $1000 - 2000 with 6 waves of that length.
3 waves above $2000-3000 dollars in value
5 waves between $3000-4000 in value
3 waves between $4000-5000 in value
Lastly, one between $5000 and 7000 in value.
With a median value of $3,783.22 per wave.
Results
There are many ways to use the data. It could be used for stop loss placement or target profits but either way, the data shows that price waves between $1000 and 2000 are the most common closely followed by waves between $3000-4000 in value.
The wavelength measure in time was very erratic. I will make another post about the time period of the waves in the future but it makes for interesting reading.
For now it seems BTC/USD is as volatile as ever but the waves lower in recent times seem to be bigger in value in comparison to bullish moves. Lets keep number crunching to see if things change.
All information and content on this website, from this website or from FX daily ltd. should be viewed as educational only. Although the author, FX daily ltd. and its contributors believe the information and contents to be accurate, we neither guarantee their accuracy nor assume any liability for errors. The concepts and methods introduced should be used to stimulate intelligent trading decisions. Any mention of profits should be considered hypothetical and may not reflect slippage, liquidity and fees in live trading. Unless otherwise stated, all illustrations are made with the benefit of hindsight. There is risk of loss as well as profit in trading. It should not be presumed that the methods presented on this website or from material obtained from this website in any manner will be profitable or that they will not result in losses. Past performance is not a guarantee of future results. It is the responsibility of each trader to determine their own financial suitability. FX daily ltd. cannot be held responsible for any direct or indirect loss incurred by applying any of the information obtained here. Futures, forex, equities and options trading contains substantial risk, is not for every trader, and only risk capital should be used. Any form of trading, including forex, options, hedging and spreads, contains risk. Past performance is not indicative of future FX daily ltd. are not Registered Financial Investment Advisors, securities brokers-dealers or brokers of the U.S. Securities and Exchange Commission or with any state securities regulatory authority OR UK FCA. We recommend consulting with a registered investment advisor, broker-dealer, and/or financial advisor. If you choose to invest, with or without seeking advice, then any consequences resulting from your investments are your sole responsibility FX daily ltd. does not assume responsibility for any profits or losses in any stocks, options, futures or trading strategy mentioned on the website, newsletter, online trading room or trading classes. All information should be taken as educational purposes only.
Recommended Content
Editors’ Picks
Ripple's move above this key level could trigger nearly 50% rally for XRP
Ripple has overcome a critical resistance level and flipped into a support floor on the weekly time frame. This development happened while XRP tightly consolidated for roughly 250 days. Investors can expect XRP to kickstart a massive rally.
Optimism price outlook with nearly $90 million worth of OP tokens flooding markets on Friday
Optimism volatility has shrunk in the ours leading to the network’s cliff unlock. It joins the likes of dYdX and Sui, which have similar events on their calendars. As token unlocks are often considered bearish catalysts, investors should brace for a reaction after the event.
Top 3 Price Prediction Bitcoin, Ethereum, Ripple: Retail watches from the sidelines with a bias for shorts
Bitcoin could clear $73,777 peak as BTC bulls resurface. Ethereum might fall 10% before next leg up as ETH RSI teases with sell signal. XRP could lose $0.6000 threshold as Ripple bulls fail to show up.
Jito price could hit $6 as JTO coils up inside this bullish pattern
Jito price action shows a potential cup and handle formation. Based on theoretical measurement rules, a successful breakout could yield a 56% rally to $6.0. A breakdown of the $3.86 support level would create a lower low for JTO and invalidate the bullish thesis.
Bitcoin: BTC may have recovered, but is it out of the woods?
Bitcoin’s (BTC) upward momentum has shown a significant decline for the past two weeks or so. This development led to a bearish signal on the weekly and an uncertain outlook on the monthly.