Binance Coin Technical Analysis: BNB full-blown sell signals aim for $22
- Binance Coin presents sell signals even as the bearish scenario awaits a confirmed breakout from a descending triangle.
- Binance whales have started to offload their wallets, putting more selling pressure on current price levels.
Binance Coin had a particularly yielding trading period at the beginning of September. Although BNB showed signs of ascending to new yearly highs, the uptrend stalled at $33.50. Following the barrier, Binance Coin embarked on a downtrend below a descending trendline. On the downside, support has been established at $25. At the time of writing, BNB/USD is trading at $26 amid a strengthening bearish trend.
Binance Coin market update chart

The rally to the highs above $30 was mainly attributed to Binance increased involvement in DeFi. The exchange has supported several DeFi tokens while launching new products such as Harvest that give users the ability to generate income by lending Bitcoin and other non-Ethereum platforms. Binance hopes to compete with DeFi platforms such as Yearn.finance, UniSwap and MarkerDAO by allowing users to collateralize debt positions (CDPs) and get stablecoins such as USDX.
Descending triangle breakdown in the offing
The 4-hour chart shows Binance Coin trading at the apex of a descending triangle pattern. Patterns of this nature are used to signal trend continuations. At the moment, BNB is holding above the triangle support. The downside is safe as long the triangle support remains intact. However, if shattered, a breakdown could ensue, pushing Binance through crucial support areas at $22 and $18 as previously discussed.
From a technical perspective, Binance Coin has resumed the downtrend. For instance, the Relative Strength Index (RSI) has not recovered above the descending trendline. Besides, the indicator could soon refresh the oversold region, a move that could spark a selloff as the price explores the support areas at $22 and $18.
BNB/USD 4-hour chart
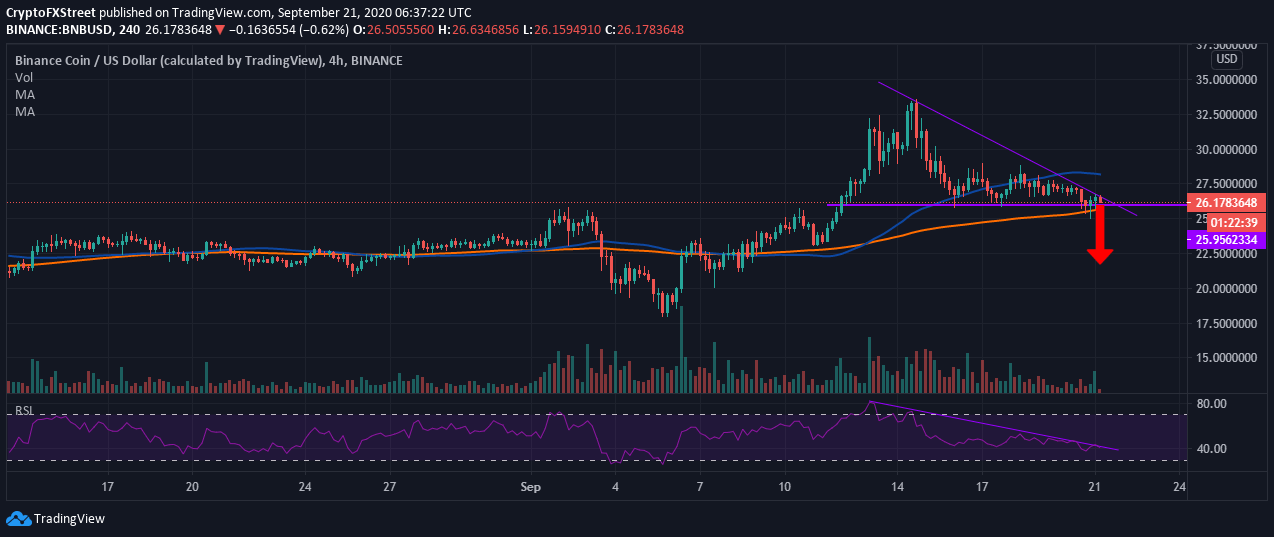
Meanwhile, the 100 Simple Moving Average (SMA) is likely to offer support, hence holding BNB above 25. If consolidation takes over at that point, the downtrend to $22 and below will be invalidated altogether. On the upside, gains above the 50 SMA could pave the way for action above $30, thereby revamping the bullish case to new yearly highs.
Binance whales reduce their holdings
As Binance seeks support from highs of $33.50 in September, whales are beginning to reduce their holdings, perhaps anticipating the price falling further. Data provided by Santiment shows that wallets holding between 10,000 and 100,000 BNB tanked from 51 on September 2 to 45 on September 17. There is also a downward trend in the wallets holding between 100,000 and 1,000,000 BNB.
 [09.47.49, 21 Sep, 2020]-637362696464105693.png)
Looking at the other side of the picture
A shorter timeframe analysis shows buyers are working hard to ensure that the bearish trend is invalidated without fail, especially now that $25 is short term support. Their effort is highlighted by the Moving Average Convergence Divergence (MACD) as it moves towards the midline. The indicator fell to -0.23 over the weekend but could soon cross into the positive region.
BNB/USD 1-hour chart
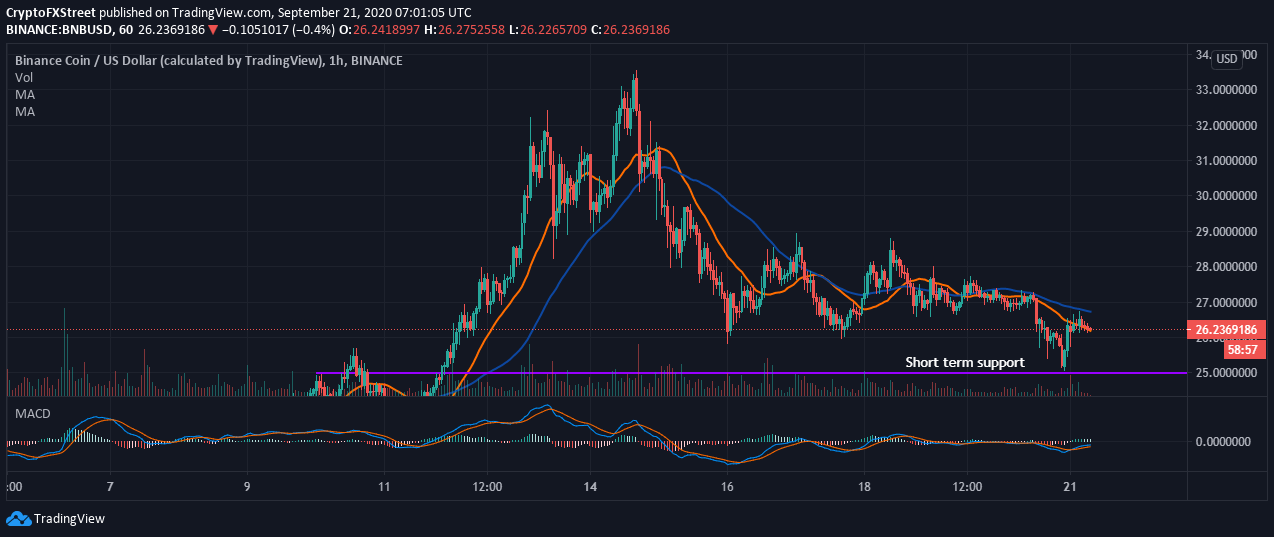
A bullish divergence from the MACD hints that buy orders are on the rise. Moreover, if the 21 SMA resistance is turned into support, then BNB will embark on the upward roll towards $30. Note that the 50 SMA resistance at $26.73 must also come down for gains to $30 to come into the picture.
Author

John Isige
FXStreet
John Isige is a seasoned cryptocurrency journalist and markets analyst committed to delivering high-quality, actionable insights tailored to traders, investors, and crypto enthusiasts. He enjoys deep dives into emerging Web3 tren


