Binance Coin Forecast: BNB aims for new yearly highs, report shows BNB is undervalued
- TokenInsight report finds Binance Coin undervalued; its estimated value is $43.
- If BNB can flip the resistance at $27.45 and $36 into support zones, the path to new yearly highs would be cut out.
- BNB/USD reacts to short term double-top pattern, support at $23, the 100 SMA and 50 SMA set to play a crucial role.
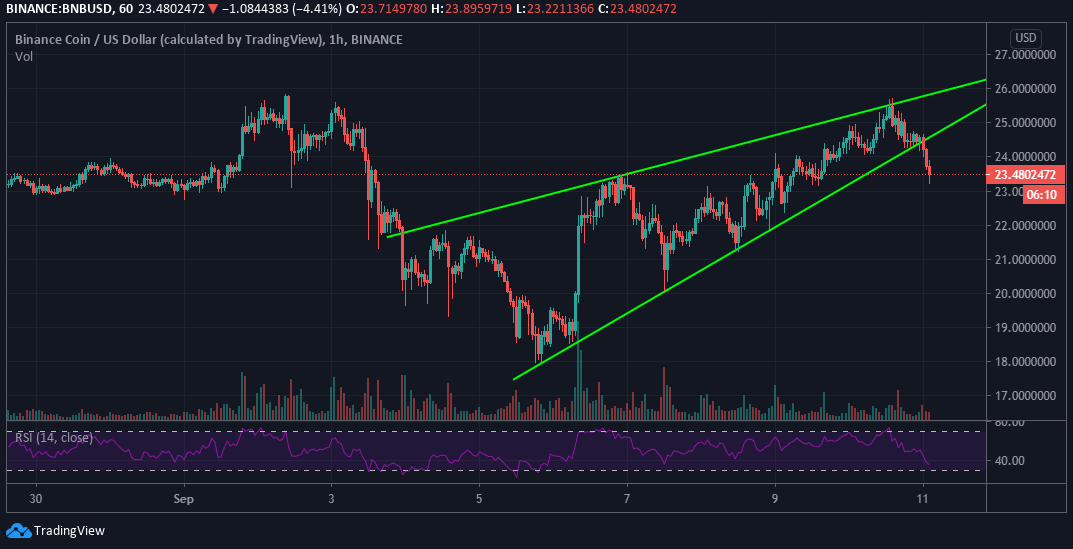
Binance Coin, the official digital coin of the largest cryptocurrency exchange by reported daily volume and number of users, Binance is on a gradual retreat from the 1-hour timeframe. Following the recent break above $25, BNB trades at $23.24 while hunting for support, preferably above $22. Short-term technical analysis using the Relative Strength Index (RSI) illustrates a bearish building trend as sellers fight to take back control. We will investigate the ability of Binance Coin to continue with the push for new yearly highs, or could it succumb to selling pressure and dip below $20?
BNB/USD 1-hour chart
Is Binance Coin Undervalued?
According to TokenInsight's August report, “it is always difficult to provide accurate valuations for digital assets.” Because at the moment, “there exists no uniform industry standard or completely reliable valuation method to discover the true value of digital assets.” However, the emergence of exchange-based tokens like BNB brings forth “inherent properties of stable currency flow, allowing the foundation of a fair price.”
TokenInsigh is the first to come up with an exchange-based token valuation report. The report finds that Binance Coin (BNB) is currently undervalued. The BNB ecosystem has grown significantly in the recent past, especially with the acquisition of CoinMarketCap, the launch of Binance Smart Chain, and the Binance mining pool.
In the wake of these developments, the price of the token has risen consistently. The valuation report suggests a price target of $27.45 for BNB and a comparable estimate of $43.83. TokenIsight says that “P/E, P/Burn Implied enterprise multiple is undergrowth average, indicating the market misprices of Binance Coin resulting in an undervalue of the BNB from its fair price.”
-637353948315448433.jpg)
Binance Coin technical analysis
The short term 1-hour chart highlighted paints a bearish picture for Binance; however, the 3-day chart shows that Binance is in the initial stages of a possible rally to new yearly highs. The price recently flipped the 50 moving average (MA) into support. This breakout seems sufficient enough to push Binance into another rally. However, two resistance zones must also be turned into support for the bullish case to properly come into the picture; these are the $28 and $36 levels.
BNB/USD 3-day chart
-637353949131096341.jpg)
The same chart also shows BNB trading above descending channel resistance. The breakout's impact could still push BNB upwards, at least past the first critical hurdle at $28. The Relative Strength Index (RSI) has paused the sharp recovery at 57. A leveling motion is taking over, also pointing towards consolidation.
The 4-hour chart, on the other hand, agrees with the hourly timeframe that BNB’s path of least resistance is downwards, at least in the near term. The price seems to be reacting to a double-top pattern formed when the price hit a barrier just below the resistance at $26 as it happened on September 2. The evening star candle on the chart cements the increased presence of the bears in the market.
BNB/USD daily chart
-637353949519534618.jpg)
However, a glance at lower levels shows that support at the 50 MA and the 100 SMA will come in handy to stop the losses from reaching earlier mentioned $22 level. If push comes to shove and losses continue, BNB would target $21 and $18.
Author

John Isige
FXStreet
John Isige is a seasoned cryptocurrency journalist and markets analyst committed to delivering high-quality, actionable insights tailored to traders, investors, and crypto enthusiasts. He enjoys deep dives into emerging Web3 tren


