Binance Coin Price Prediction: A 2-day reversal pattern spelling bad news
- Binance Coin price has printed a shooting star pattern on the 2-day chart.
- BNB price is finding resistance from the 8-day exponential moving average.
- Invalidation of the bearish thesis could occur if the bulls hurdle the $290 level and find stable support.

Binance Coin price shows reasons to believe in another selloff. Key levels have been identified.
Binance Coin price could fall once more
Binance Coin price warrants concern as the most recent selloff shows a classic reversal pattern within the price action. Binance Coin price lost 7% of market value amidst the most recent selloff. A bearish engulfing candle was established on the 2-day chart, which finalizes a much larger shooting star reversal pattern. Amongst price action traders, this pattern is a “get out of the way signal,” expressing more losses could ensue.
Binance Coin price currently auctions at $279. The bears are flexing their grip as the bulls have lost support from both the 8-day exponential moving average and the 21-day simple moving average. The Relative Strength index (RSI) still hovers in supportive territory but has about 16% of cushion space. Translating the RSI reading into the current market value, the BNB price could fall to the $233 level if market conditions persist.
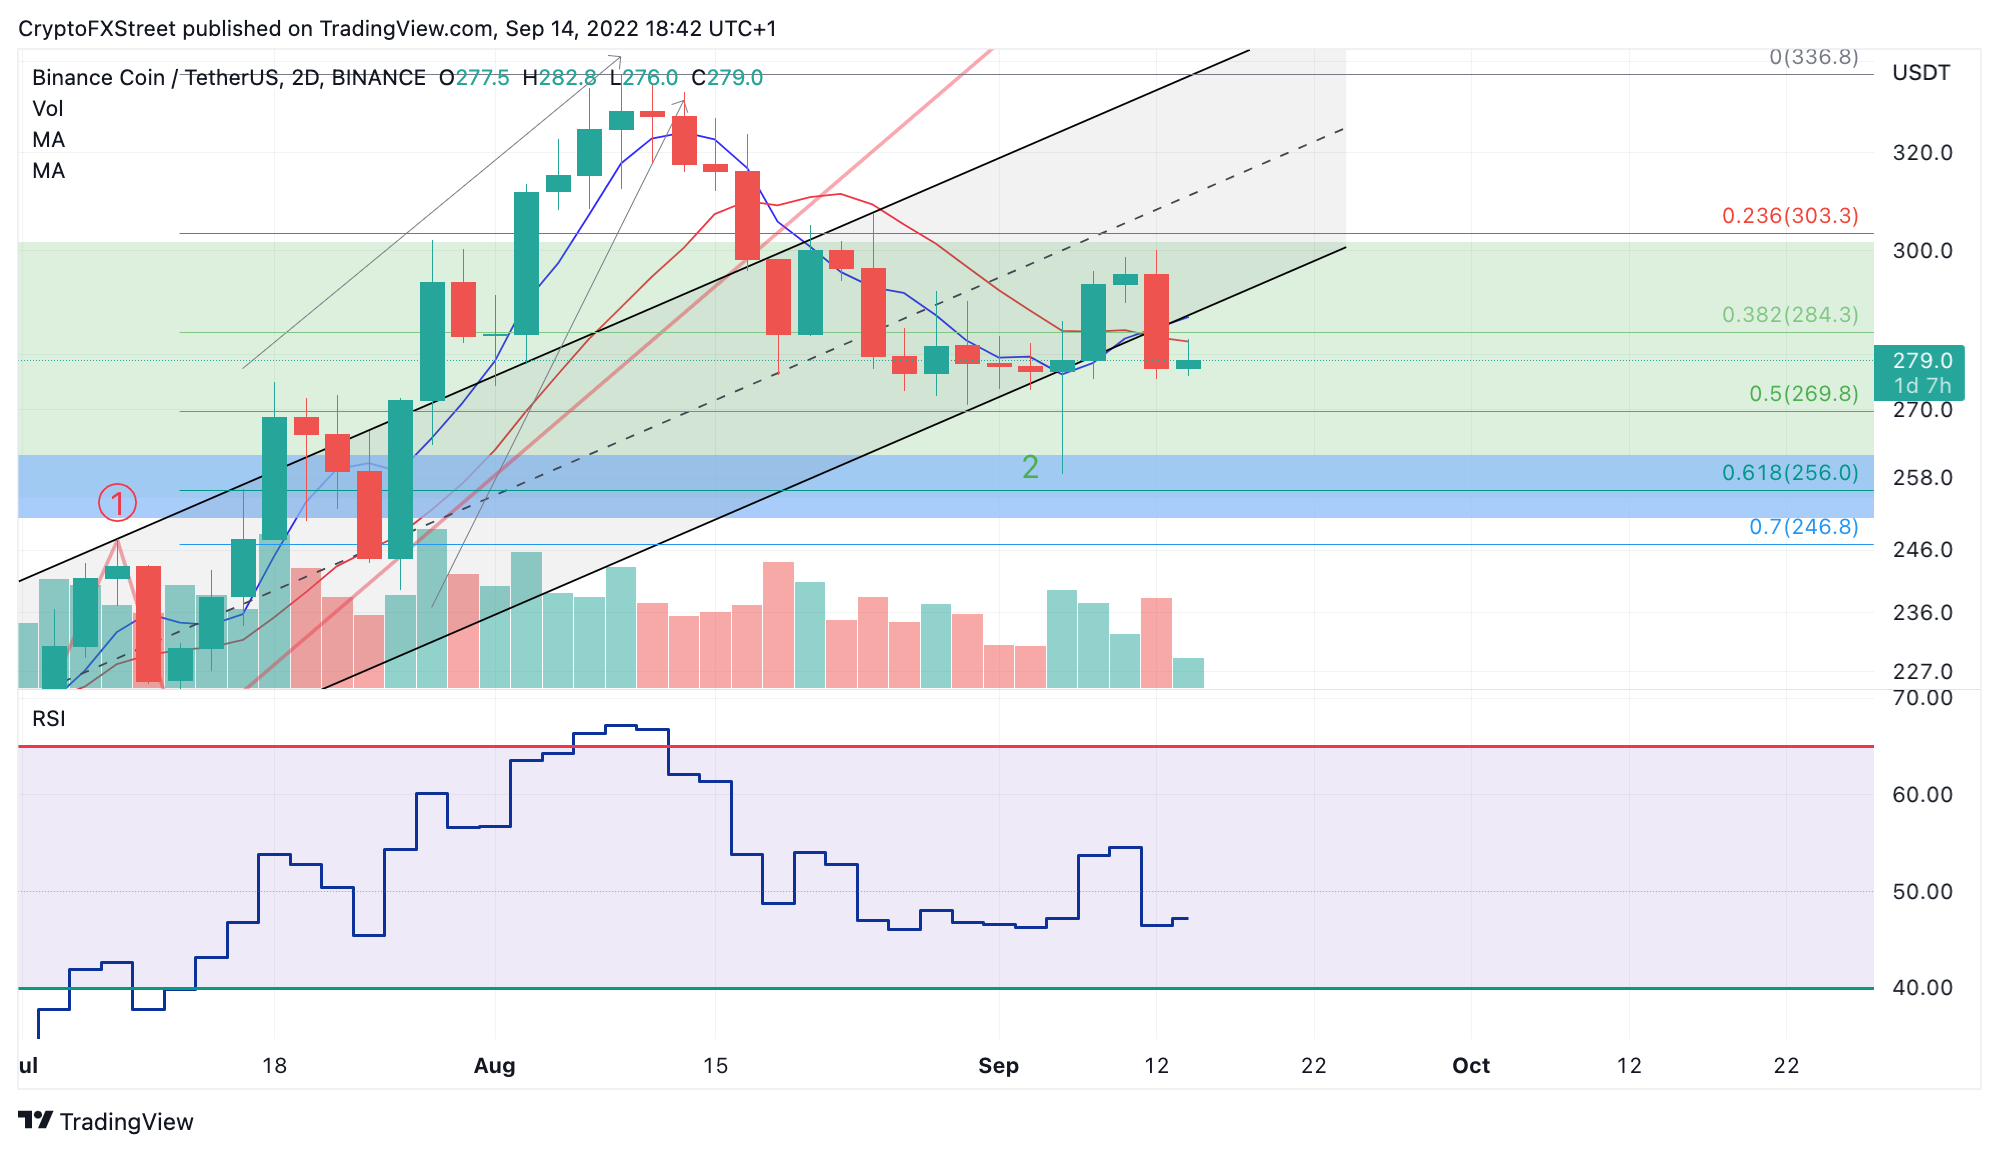
BNB USDT 2-Day Chart
Invalidation of the bearish thesis could occur if the bulls reconquer both moving averages. A closing 2-day candle above $290 could prompt a countertrend rally towards the summertime high at $336.8. Such a move would result in a 20% increase from the current Binance Coin price.
In the following video, our analysts deep dive into the price action of Binance Coin, analyzing key levels of interest in the market. -FXStreet Team
Author

Tony M.
FXStreet Contributor
Tony Montpeirous began investing in cryptocurrencies in 2017. His trading style incorporates Elliot Wave, Auction Market Theory, Fibonacci and price action as the cornerstone of his technical analysis.