Hyperliquid Price Forecast: HYPE consolidates amid steady DeFi TVL
- Hyperliquid holds above $30.00, with the 50-day EMA providing support.
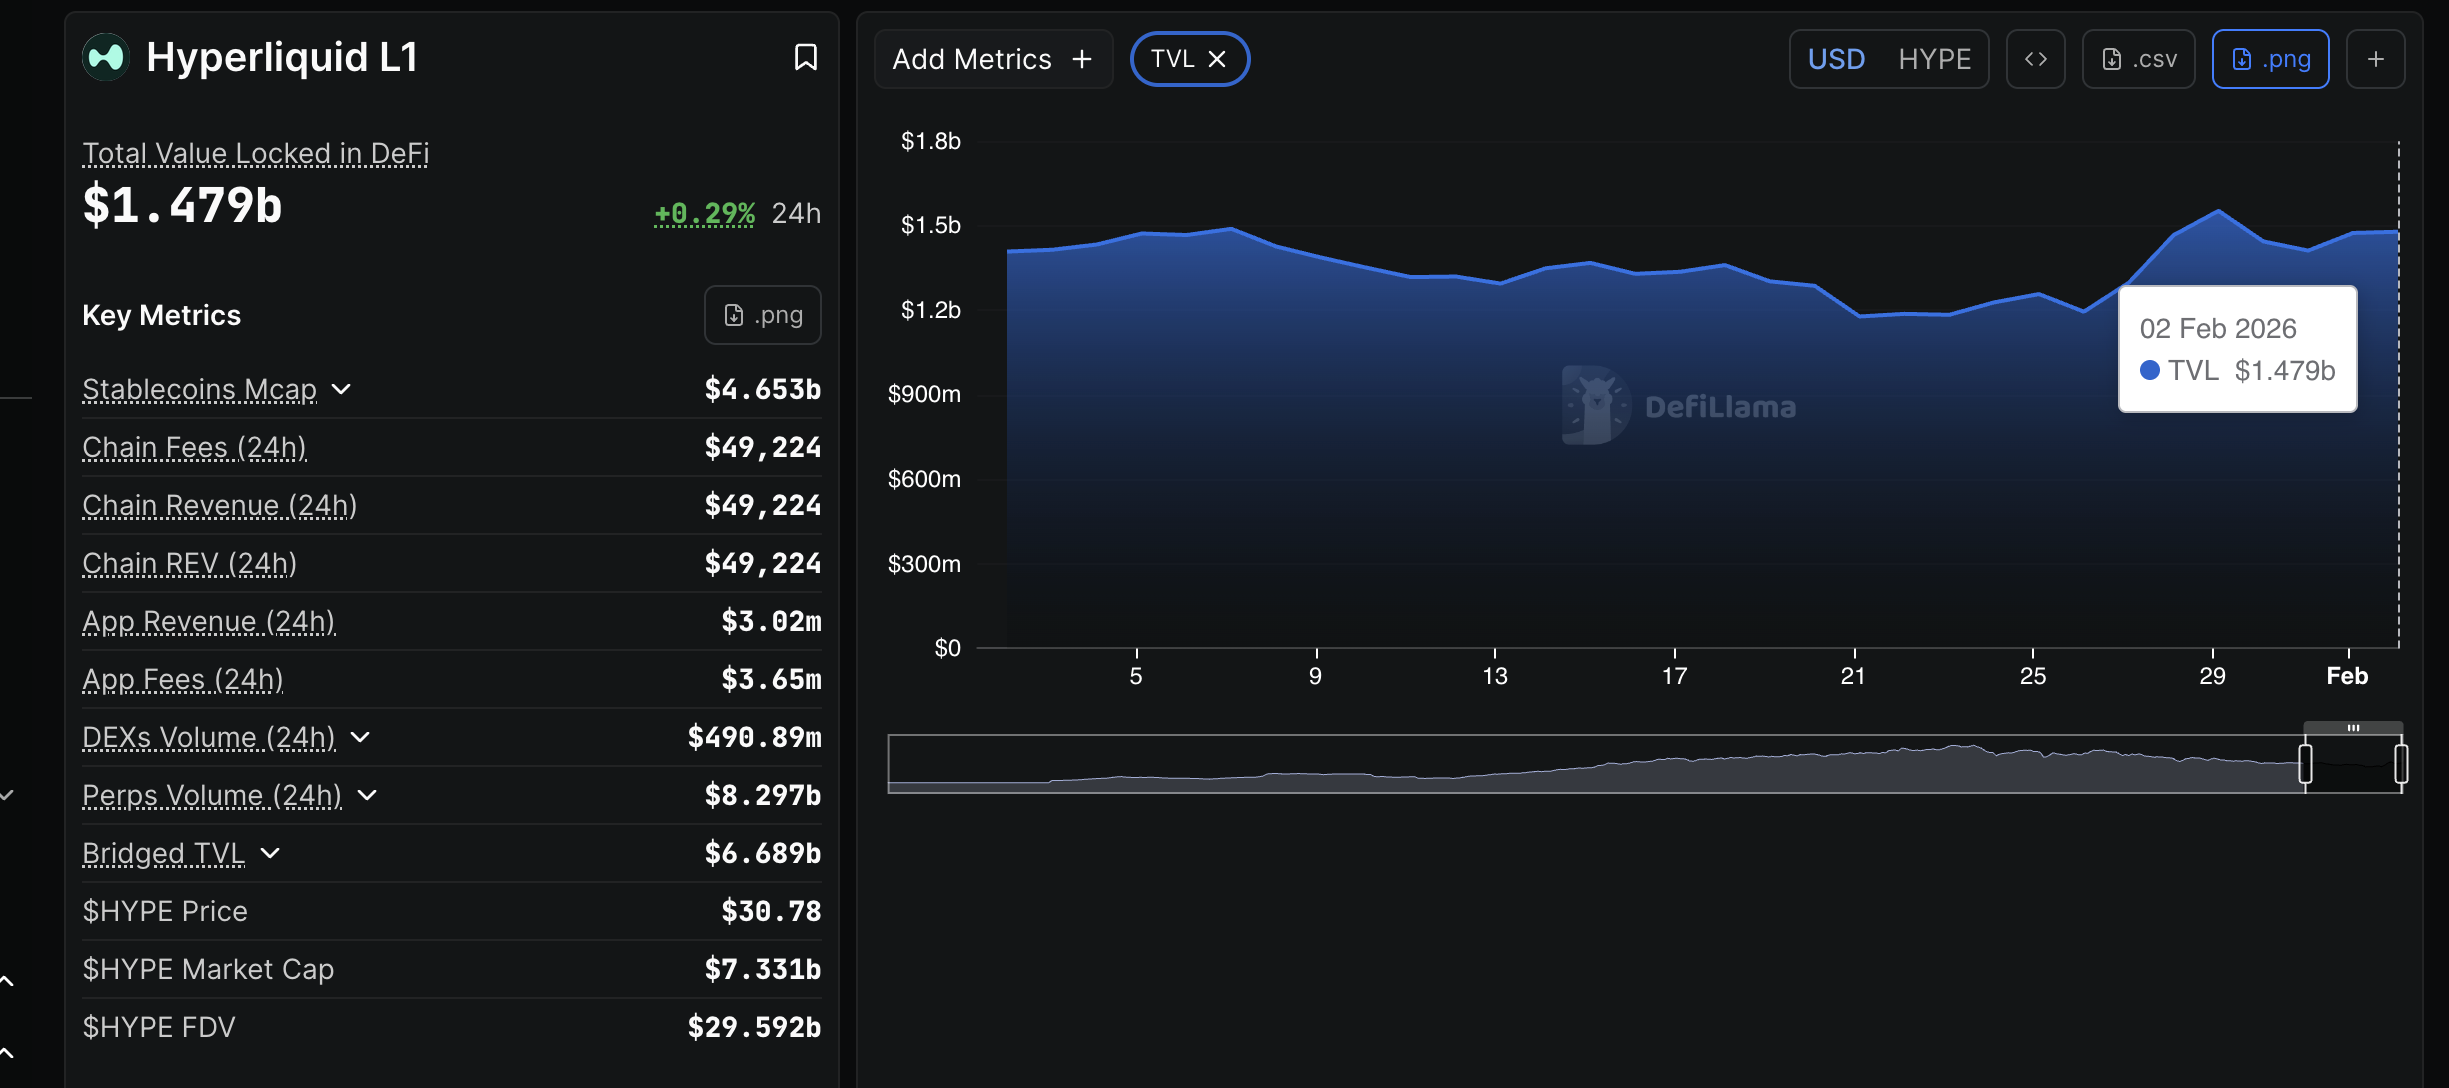
- HYPE’s DeFi TVL increases slightly to $1.5 billion, signaling growing speculative risk appetite.
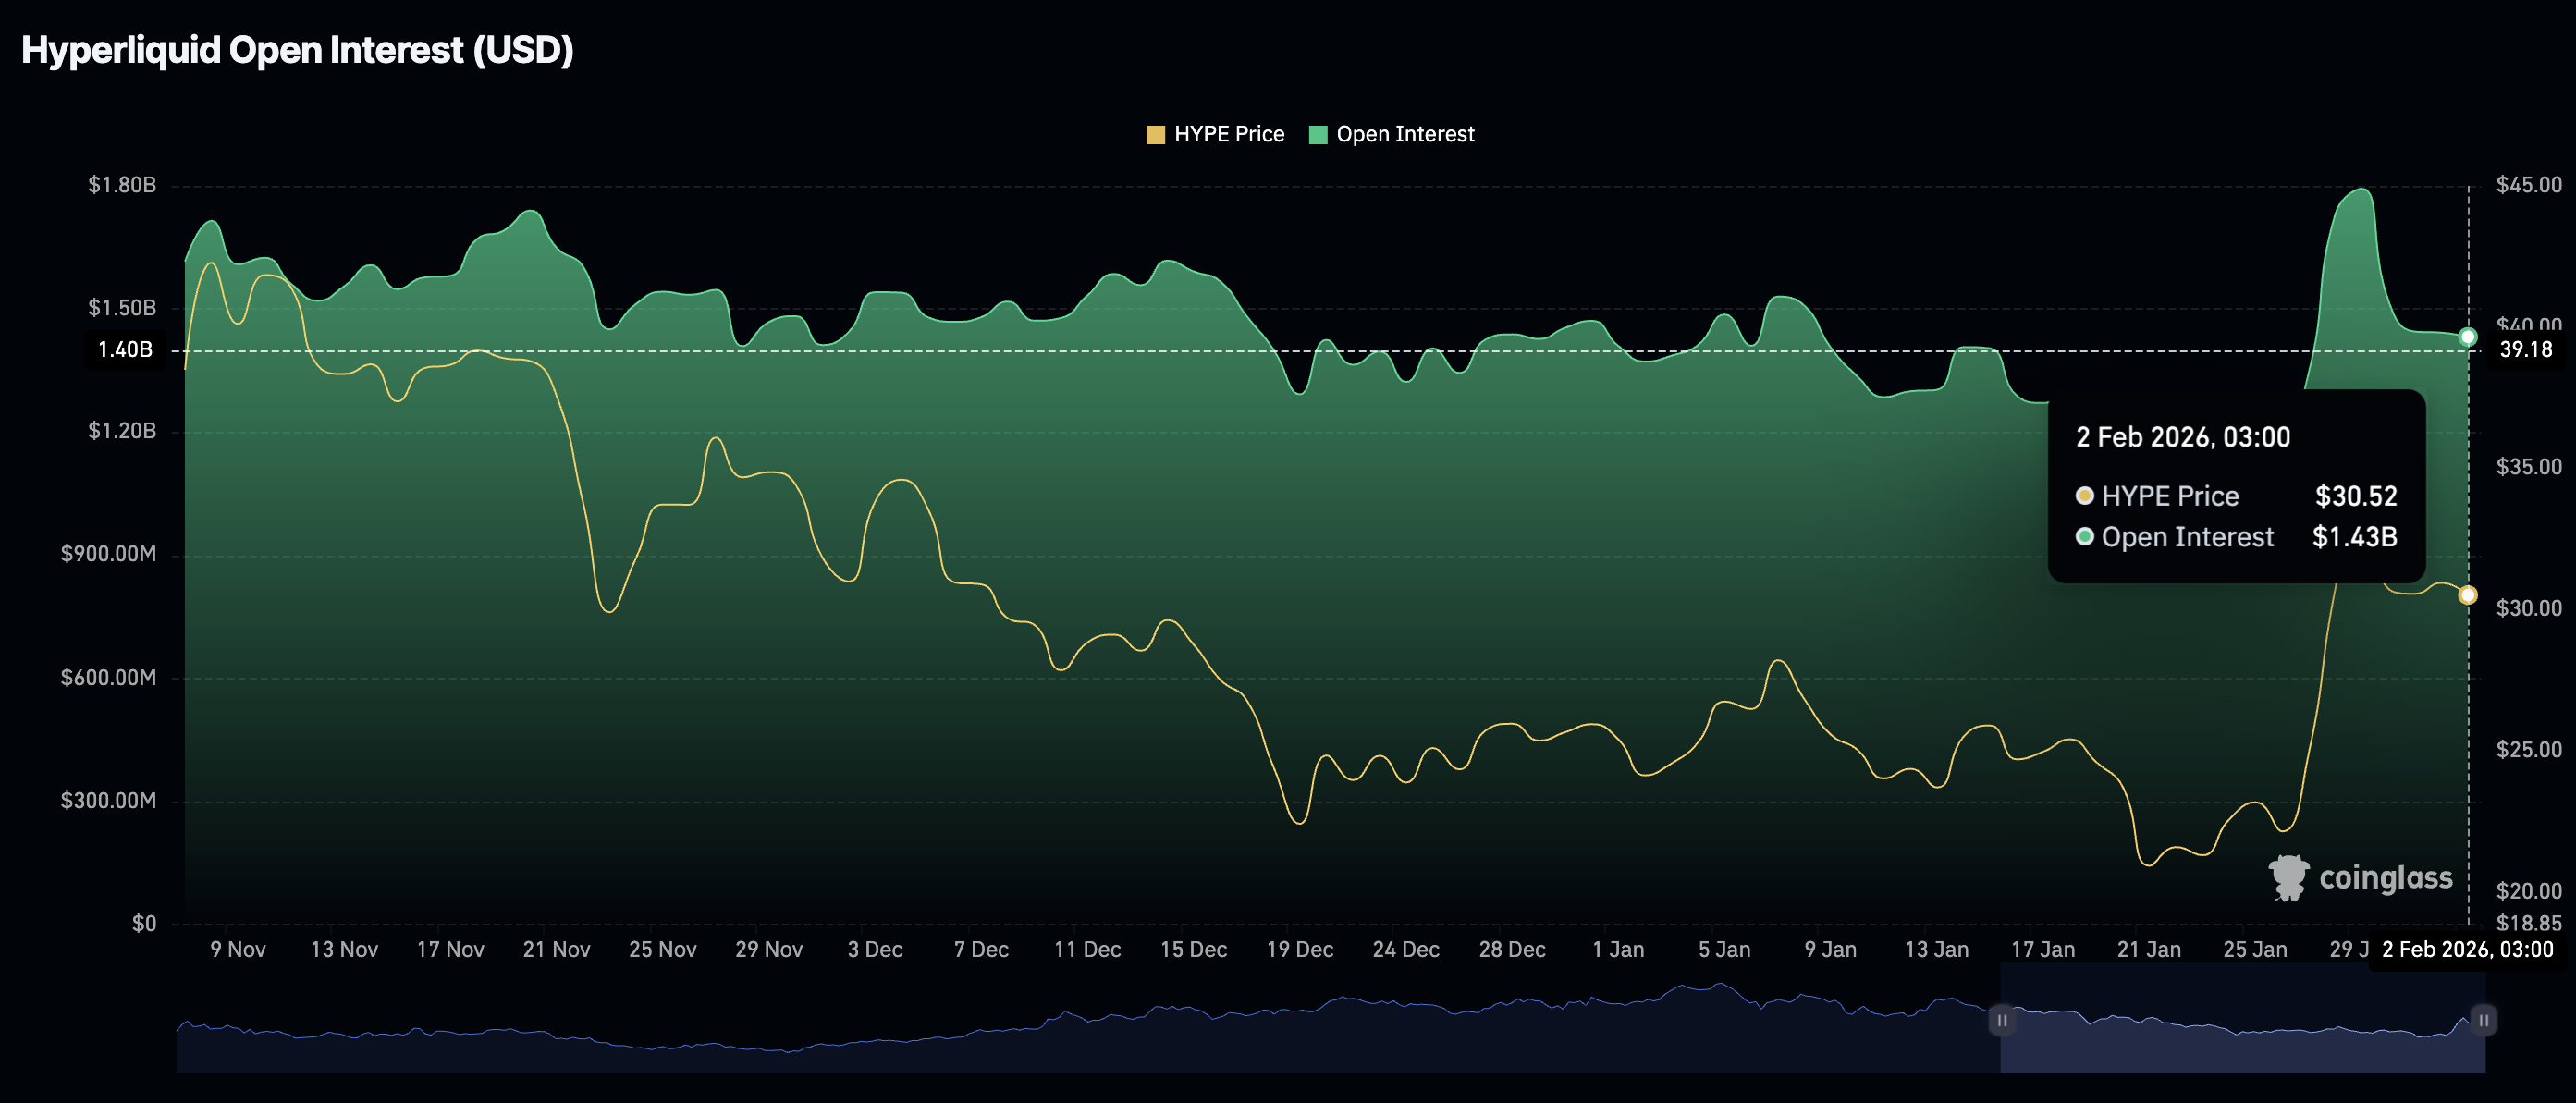
- Retail interest remains low as futures Open Interest declines to $1.43 billion.

Hyperliquid (HYPE) edges higher above the $30.00 support on Monday, as prices generally rebound across the crypto market following last week’s turbulence. The decentralized exchange (DEX) native token is up over 5% intraday and looks poised to extend the uptrend.
DeFi TVL supports Hyperliquid’s modest gains
Hyperliquid’s Decentralized Finance (DeFi) sector has remained relatively stable over the past few days, with the Total Value Locked (TVL) rising to $1.5 billion on Monday, from $1.41 billion on Saturday.
The uptick in TVL, which tracks the total notional value of all coins held in smart contracts on the chain, suggests a modest uptick in speculative risk appetite and confidence in the token among participants.
Meanwhile, retail interest remains relatively muted as futures Open Interest (OI) declines slightly from $1.43 billion on Monday from $1.44 billion the previous day. OI tracks the notional value of outstanding futures contracts, whereby persistent declines signal a lack of investor confidence in the token.
Traders tend to close open positions rather than open new ones, depriving Hyperliquid of the much-needed buying pressure to sustain an uptrend.
Technical outlook: HYPE extends recovery
Hyperliquid exhibits stability above $30.00, marking an improvement in technical structure. The token is supported by the 50-day Exponential Moving Average (EMA) at $27.58 and the 100-day EMA at $30.45.
Meanwhile, the Moving Average Convergence Divergence (MACD) sits in positive territory with the MACD line above the signal line on the daily chart, though the histogram is contracting, suggesting momentum is cooling. The Relative Strength Index (RSI) is at 62.54 on the same chart, and not overbought, which supports a push toward resistance the 200-day EMA at $32.68. A break above this moving average could accelerate the uptrend to the next hurdle at $35.01, tested last week.
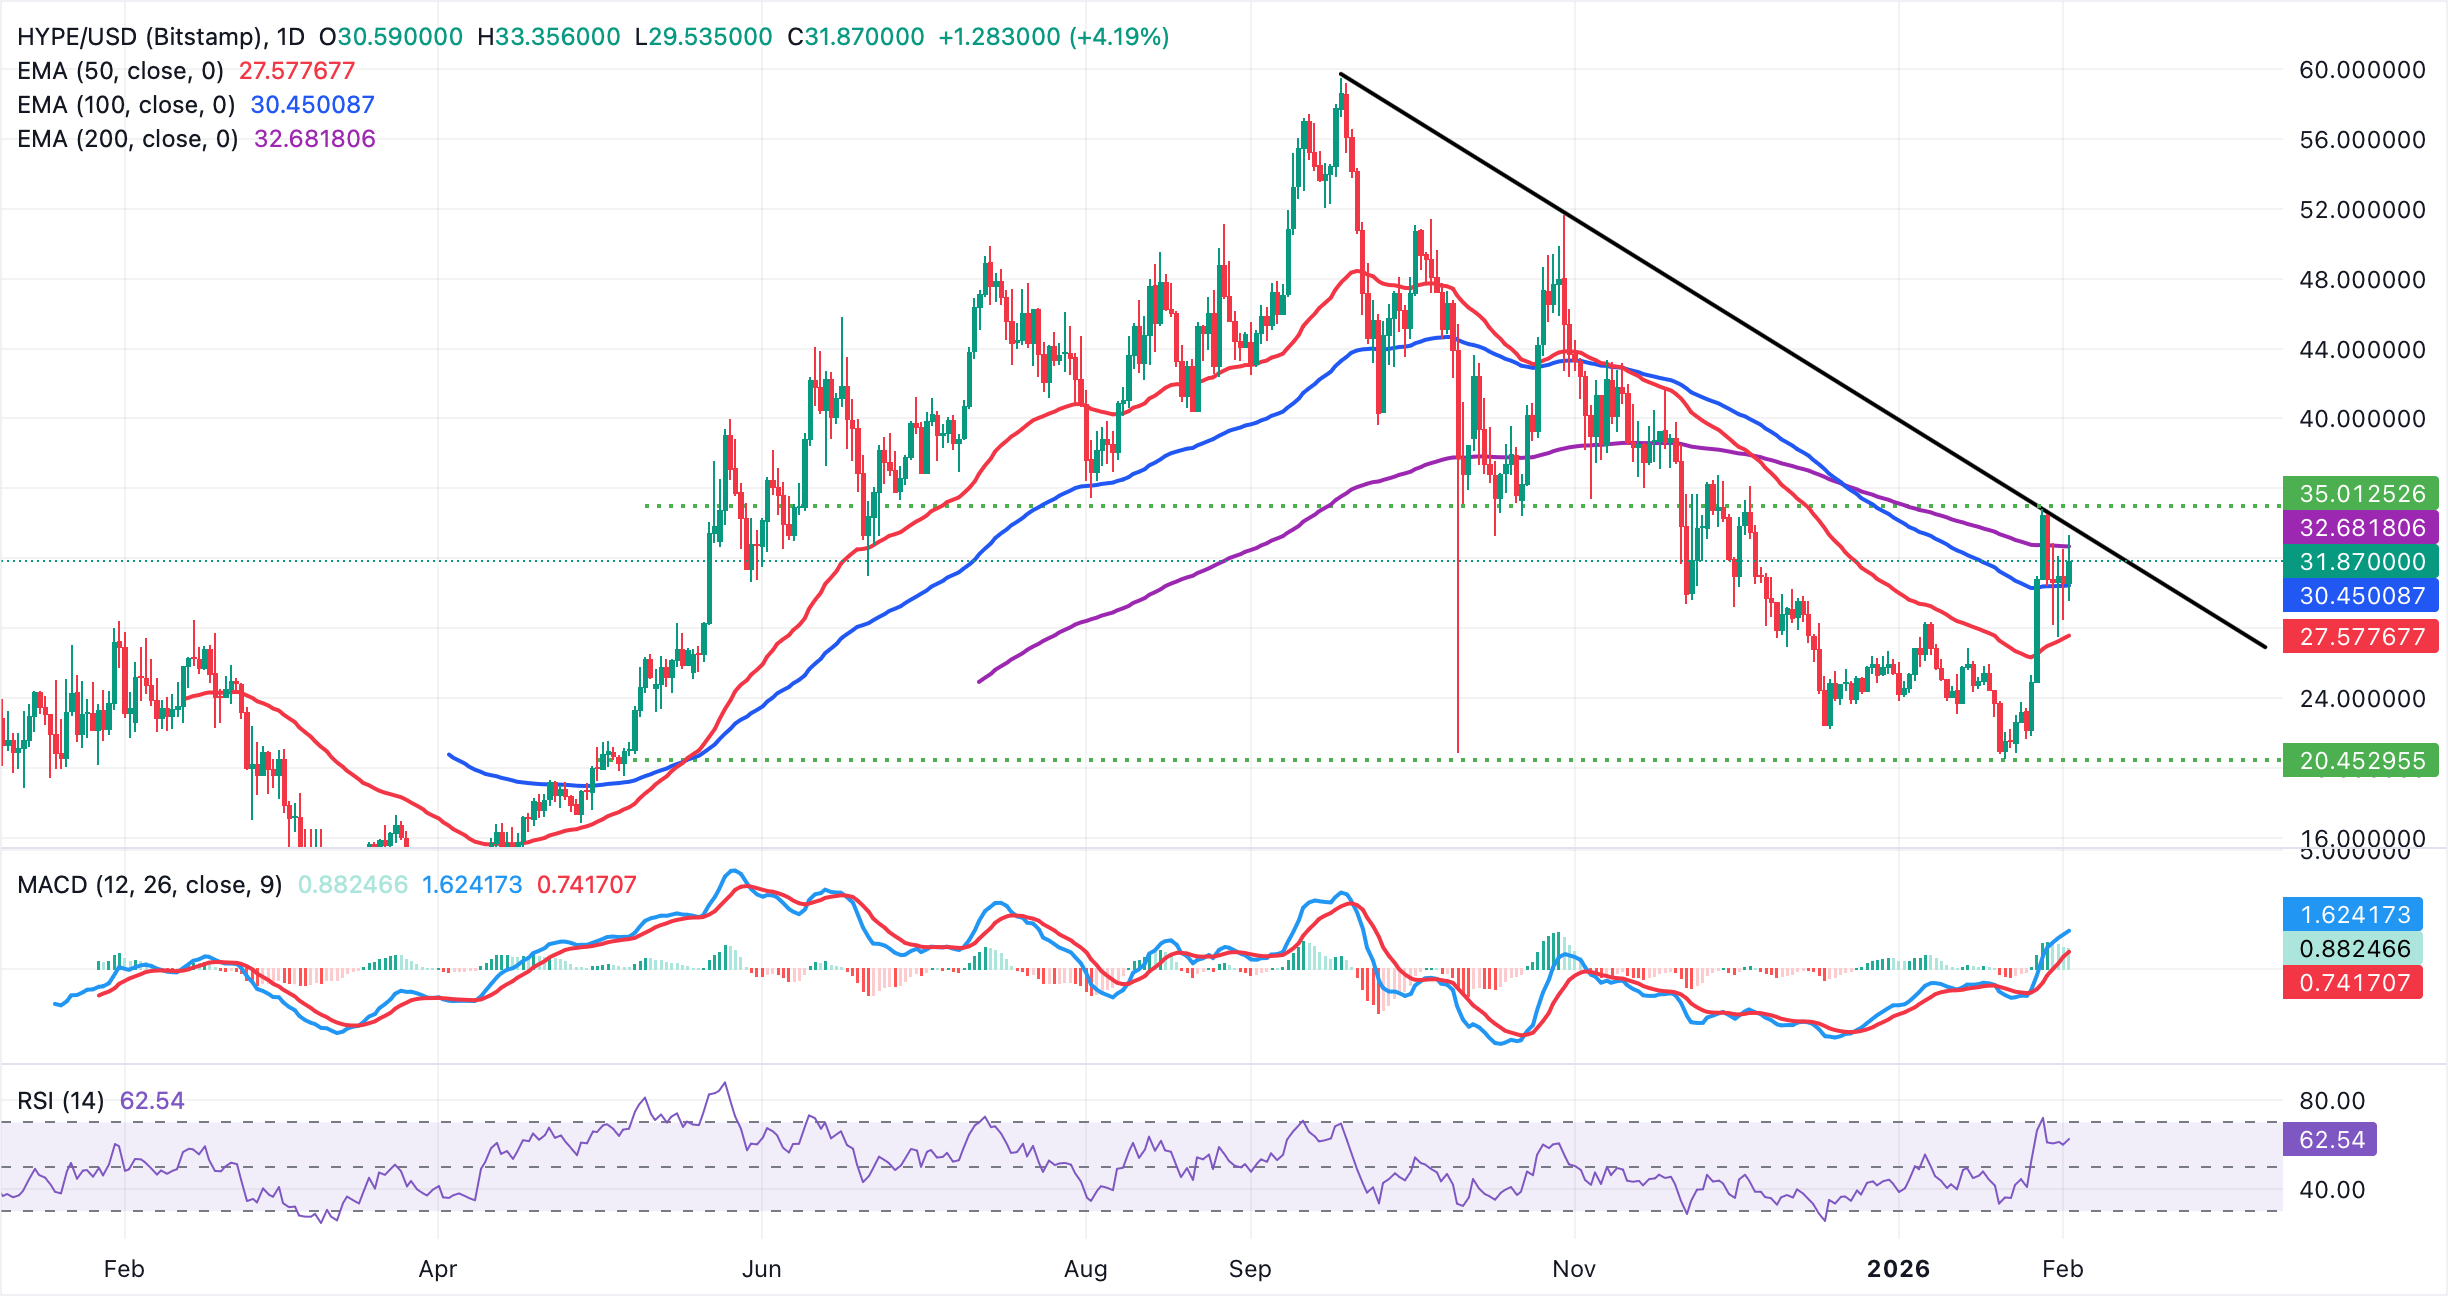
Still, the descending trend line from $59.71 limits gains, and resistance is seen at $33.77. A close below the 100-day EMA at $30.45 may stretch the downtrend toward the 50-day EMA support at $27.58.
Open Interest, funding rate FAQs
Higher Open Interest is associated with higher liquidity and new capital inflow to the market. This is considered the equivalent of increase in efficiency and the ongoing trend continues. When Open Interest decreases, it is considered a sign of liquidation in the market, investors are leaving and the overall demand for an asset is on a decline, fueling a bearish sentiment among investors.
Funding fees bridge the difference between spot prices and prices of futures contracts of an asset by increasing liquidation risks faced by traders. A consistently high and positive funding rate implies there is a bullish sentiment among market participants and there is an expectation of a price hike. A consistently negative funding rate for an asset implies a bearish sentiment, indicating that traders expect the cryptocurrency’s price to fall and a bearish trend reversal is likely to occur.
(The technical analysis of this story was written with the help of an AI tool.)
Author

John Isige
FXStreet
John Isige is a seasoned cryptocurrency journalist and markets analyst committed to delivering high-quality, actionable insights tailored to traders, investors, and crypto enthusiasts. He enjoys deep dives into emerging Web3 tren



