• Main cryptos surged on Friday, raising up to 10% in some cases, in a kind of movement that tends to happen when the big hands enter the market.
  • Generalized consolidation settings that can favor the appearance of good buying points.

Pleasing weekend for most of the main cryptos, with 3% raises corrected in the early European morning. Most of the assets managed to break key resistances, so the support levels are clear.

On Friday, a sudden, high-volume buy operation took Bitcoin's price from $6,950 to $8,100. This kind of disruptive movement in a news-free environment usually takes place when an operator opens an important position in a narrow market.

Europe's session starts quietly, in an apparently calm situation. Consolidation seems to be the session's goal, with possible low-volume bearish moves.

BTC/USD 60 min

Bitcoin moves slightly above the main support. In the short-term, the 60 min chart shows the price constrained between that support, at $8,060, and the EMA as a resistance at $8,130. There can be fast tests at the 100-SMA at $7,950. There are weak supports at $7,800 and $7,700. Above, it needs to break and exceed $8,300 to come into a price band topped at $9,500 with options to be the price range in the long-term.

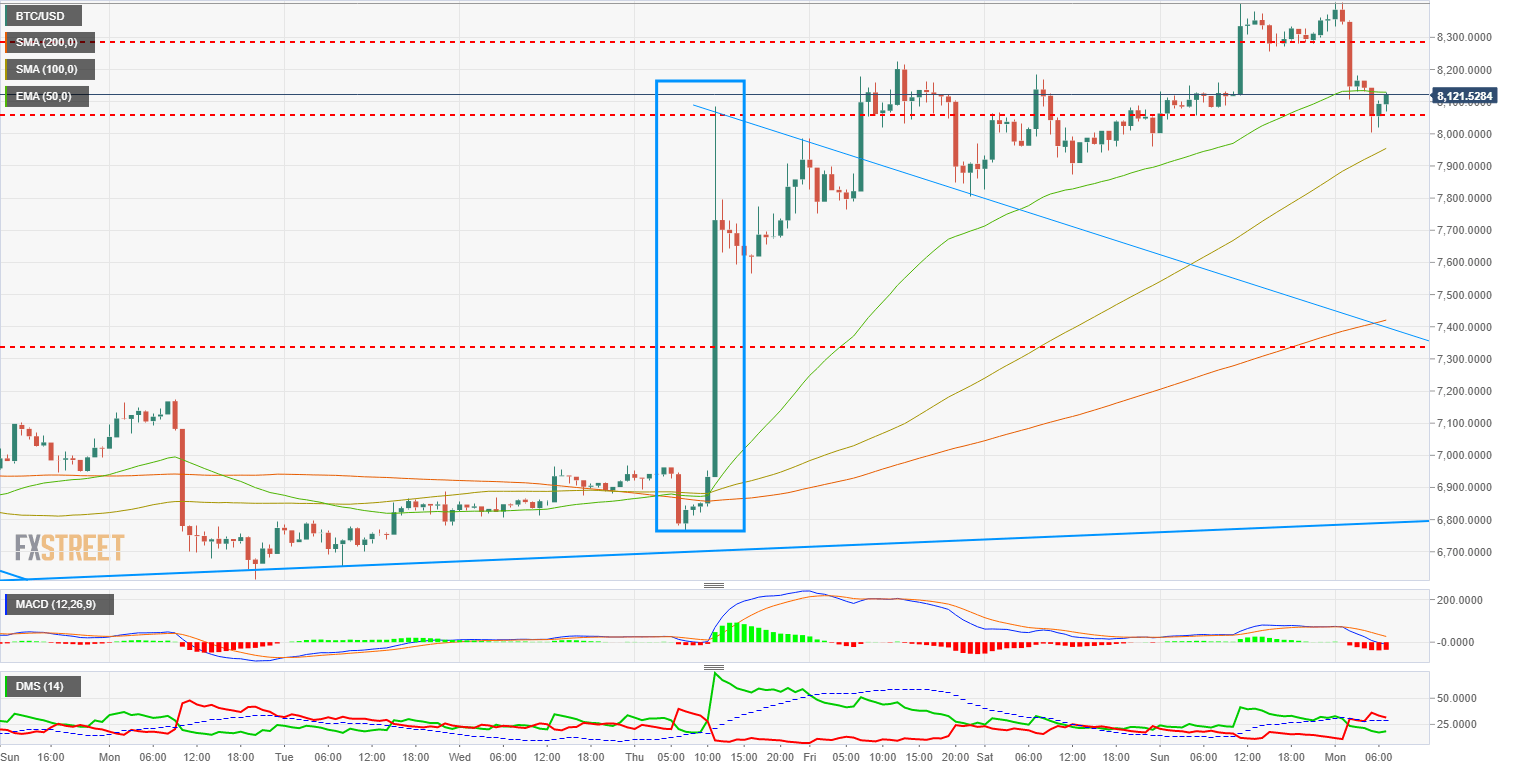
The 60 min MACD lays over the 0, with a significant line openness that predicts some volatility.

The Directional Movement Index confirms the retreat, with sales surpassing purchases, although the latter doesn't decrease too much. The D+ is above the ADX, so the current setting can remain all the session.

LTC/USD 240 min

Litecoin moves between two key levels acting as support and resistance. It can move freely between $120 and $135, and as long as it stays in this range, it won't provide any evidence of future movements. The 200-SMA is in the resistance zone, while the 100-SMA moves close to the first support. Right now, Litecoin is above the 50-EMA, at $124,50.

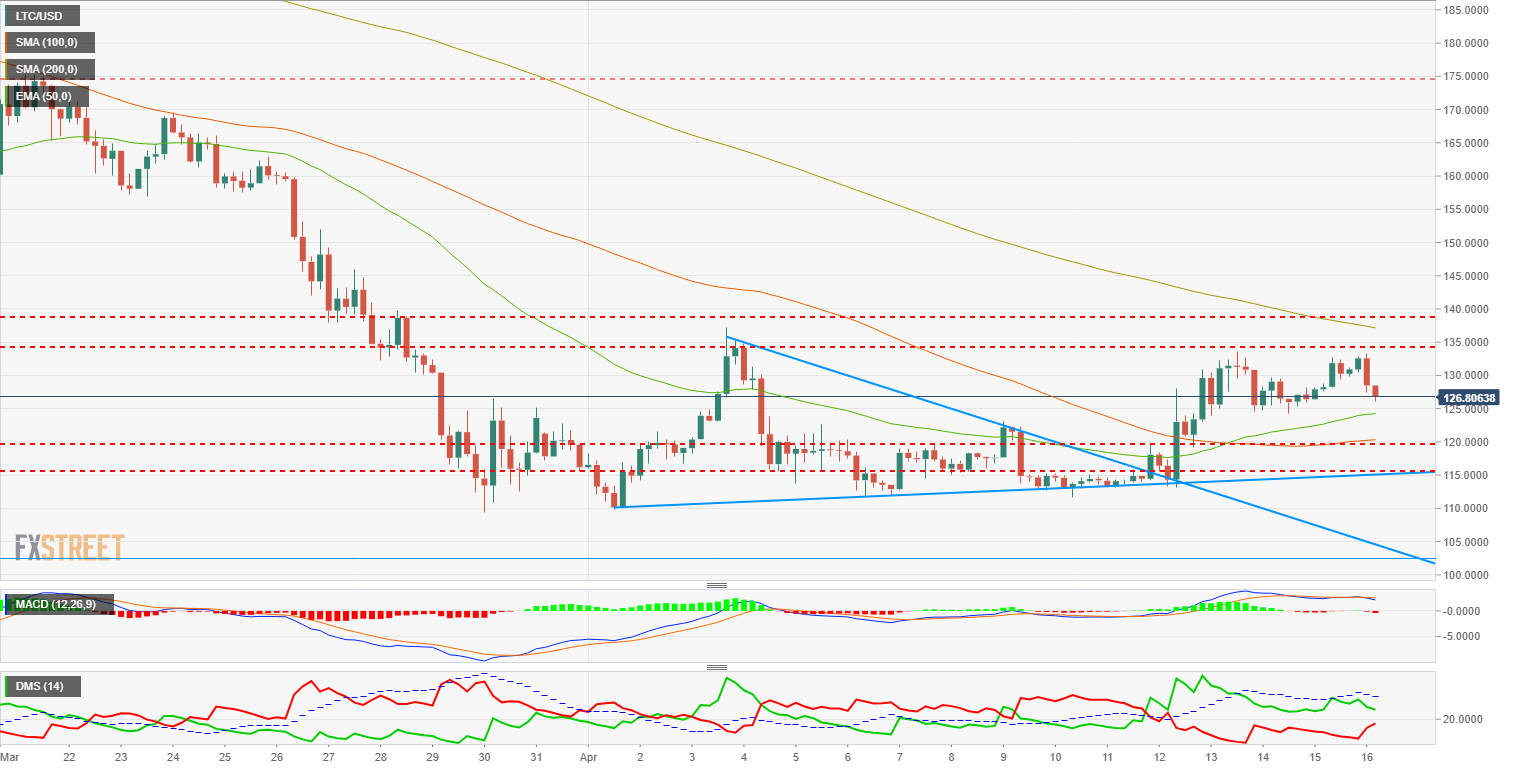
The MACD confirms the consolidation scene, without dismissing bearish walks down to $120. There's still way to go until the 0 line, so the current setting can be prolonged.

The Directional Movement Index shows buyers dominating but having lost some volume since Friday. Sellers have increased and are now closer to the purchasers. The ADX is still in levels of active trend and hasn't decreased. Continuity.

XRP/USD 240 min

Ripple has lost the conquered level of $0.67 and could test moving averages around $0.60, where the 50-EMA stands, with possible decreases to $0.58-0.56. Above, it must get the $0.67 back to keep raising up to $0.77 without any main resistance on its way up. The next key level is at $0.85.

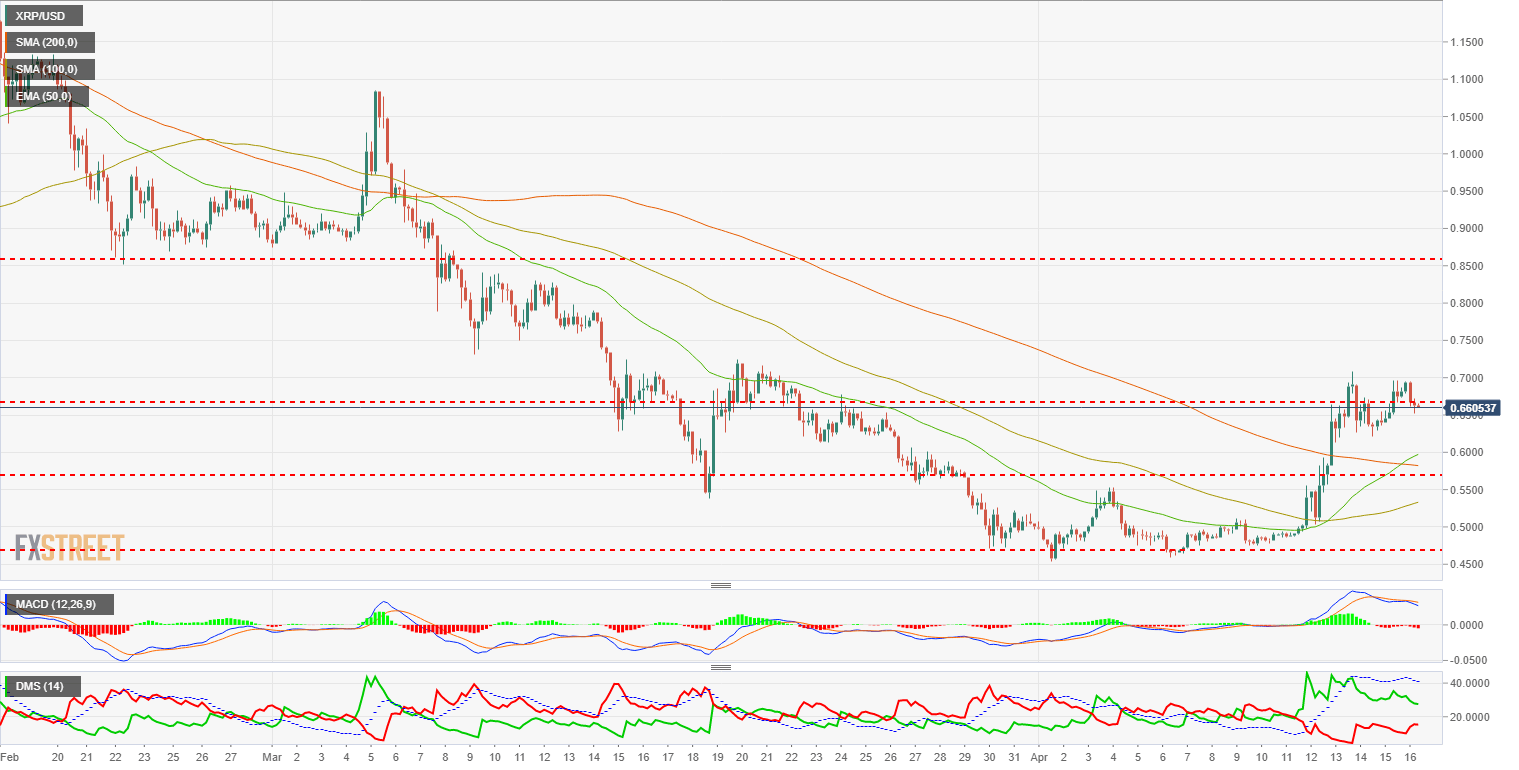
The 240 min MACD shows a profile favorable to retreats in a still bullish setting. Due to the height, the move can provide volatility.

The Directional Movement Index shows buyers still in control, although sellers have increased. The D+ moves below the ADX and hasn't still tested it, favoring the volatility increase due to the apparent contradiction of indicators.

ETH/USD 240 min

Ethereum, like the rest of cryptos, moved upwards. It settled somewhat below $520, but it's the only one that had a successful second test to set new relative maximums and reject the threat of a doji candle. Main support at $485, with moving averages below, 200-SMA at $473 and 50-EMA at $470. 100-SMA is at the next key support at $420. Above, resistance zone between $560 and $585, followed by free way to $620.

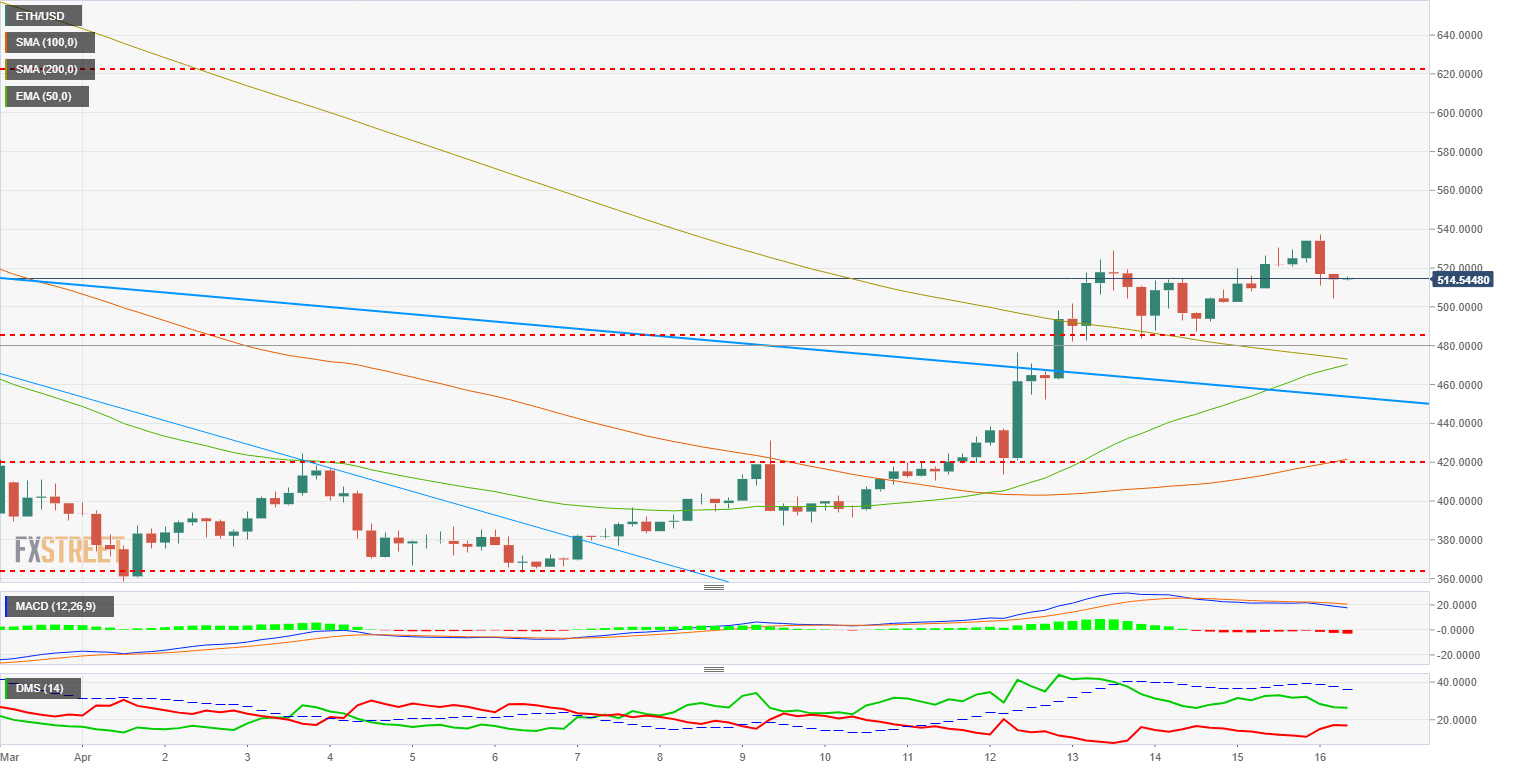
The 240 min MACD is similar to XRP/USD's. It doesn't reject a bearish consolidation trend. It also shows a discrepancy with the second bullish move.

The Directional Movement Index also shows buyers keeping control but sellers getting close.


Information on these pages contains forward-looking statements that involve risks and uncertainties. Markets and instruments profiled on this page are for informational purposes only and should not in any way come across as a recommendation to buy or sell in these assets. You should do your own thorough research before making any investment decisions. FXStreet does not in any way guarantee that this information is free from mistakes, errors, or material misstatements. It also does not guarantee that this information is of a timely nature. Investing in Open Markets involves a great deal of risk, including the loss of all or a portion of your investment, as well as emotional distress. All risks, losses and costs associated with investing, including total loss of principal, are your responsibility. The views and opinions expressed in this article are those of the authors and do not necessarily reflect the official policy or position of FXStreet nor its advertisers. The author will not be held responsible for information that is found at the end of links posted on this page.

If not otherwise explicitly mentioned in the body of the article, at the time of writing, the author has no position in any stock mentioned in this article and no business relationship with any company mentioned. The author has not received compensation for writing this article, other than from FXStreet.

FXStreet and the author do not provide personalized recommendations. The author makes no representations as to the accuracy, completeness, or suitability of this information. FXStreet and the author will not be liable for any errors, omissions or any losses, injuries or damages arising from this information and its display or use. Errors and omissions excepted.

The author and FXStreet are not registered investment advisors and nothing in this article is intended to be investment advice.

Join Telegram

Recommended content


Recommended Content

Editors’ Picks

Ethereum dips slightly amid Renzo depeg, BlackRock spot ETH ETF amendment

Ethereum dips slightly amid Renzo depeg, BlackRock spot ETH ETF amendment

Ethereum (ETH) suffered a brief decline on Wednesday afternoon despite increased accumulation from whales. This follows Ethereum restaking protocol Renzo restaked ETH (ezETH) crashing from its 1:1 peg with ETH and increased activities surrounding spot Ethereum ETFs.

More Ethereum News

Injective price weakness persists despite over 5.9 million INJ tokens burned

Injective price weakness persists despite over 5.9 million INJ tokens burned

Injective (INJ) price is trading with a bearish bias, stuck in the lower section of the market range. The bearish outlook abounds despite the network's deflationary efforts to pump the price. Coupled with broader market gloom, INJ token’s doomed days may not be over yet.

More Injective News

US intensifies battle against crypto privacy protocols following crackdown on Samourai Wallet

US intensifies battle against crypto privacy protocols following crackdown on Samourai Wallet

CEO Keonne Rodriguez and CTO William Lonergan of Samourai Wallet were arrested by the US Department of Justice (DoJ) on Wednesday and charged with $100 million in money laundering on a count and illegal money transmitting on another count. This move could see privacy-focused cryptocurrencies take a dip.

More Cryptocurrencies News

Near Protocol Price Prediction: NEAR fulfills targets but a 10% correction may be on the horizon

Near Protocol Price Prediction: NEAR fulfills targets but a 10% correction may be on the horizon

Near Protocol price has completed a 55% mean reversal from the bottom of the market range at $4.27. Amid growing bearish activity, NEAR could drop 10% to the $6.00 psychological level before a potential recovery. A break and close above $7.95 would invalidate the downleg thesis.

More Near Protocol News

Bitcoin: BTC post-halving rally could be partially priced in Premium

Bitcoin: BTC post-halving rally could be partially priced in

Bitcoin (BTC) price briefly slipped below the $60,000 level for the last three days, attracting buyers in this area as the fourth BTC halving is due in a few hours. Is the halving priced in for Bitcoin? Or will the pioneer crypto note more gains in the coming days? 

Read full analysis

BTC

ETH

XRP