|

Band Protocol Price looks for a pullback after a 34% upswing to $5.2

  • BAND price has seen a 34% explosion in the past 48 hours, jumping to $5.2.
  • The digital asset is ready for a pullback after such a hefty price spike.

BAND has been trading in a daily downtrend since its 2020-high at $17 formed on September 2. Despite the recent 34% upswing, the digital asset is still down by 70%, trying to recover. The TD Sequential indicator is on the verge of presenting a sell signal on the 4-hour chart, which could spark a pullback.

BAND's price at risk of a pullback if the sell signal materializes 

The TD Sequential indicator on the 4-hour chart has presented a green '8' signal, usually followed by a green '9', representing a strong sell signal. Additionally, the RSI hasn't been as overextended as it is now since September 2.

band price

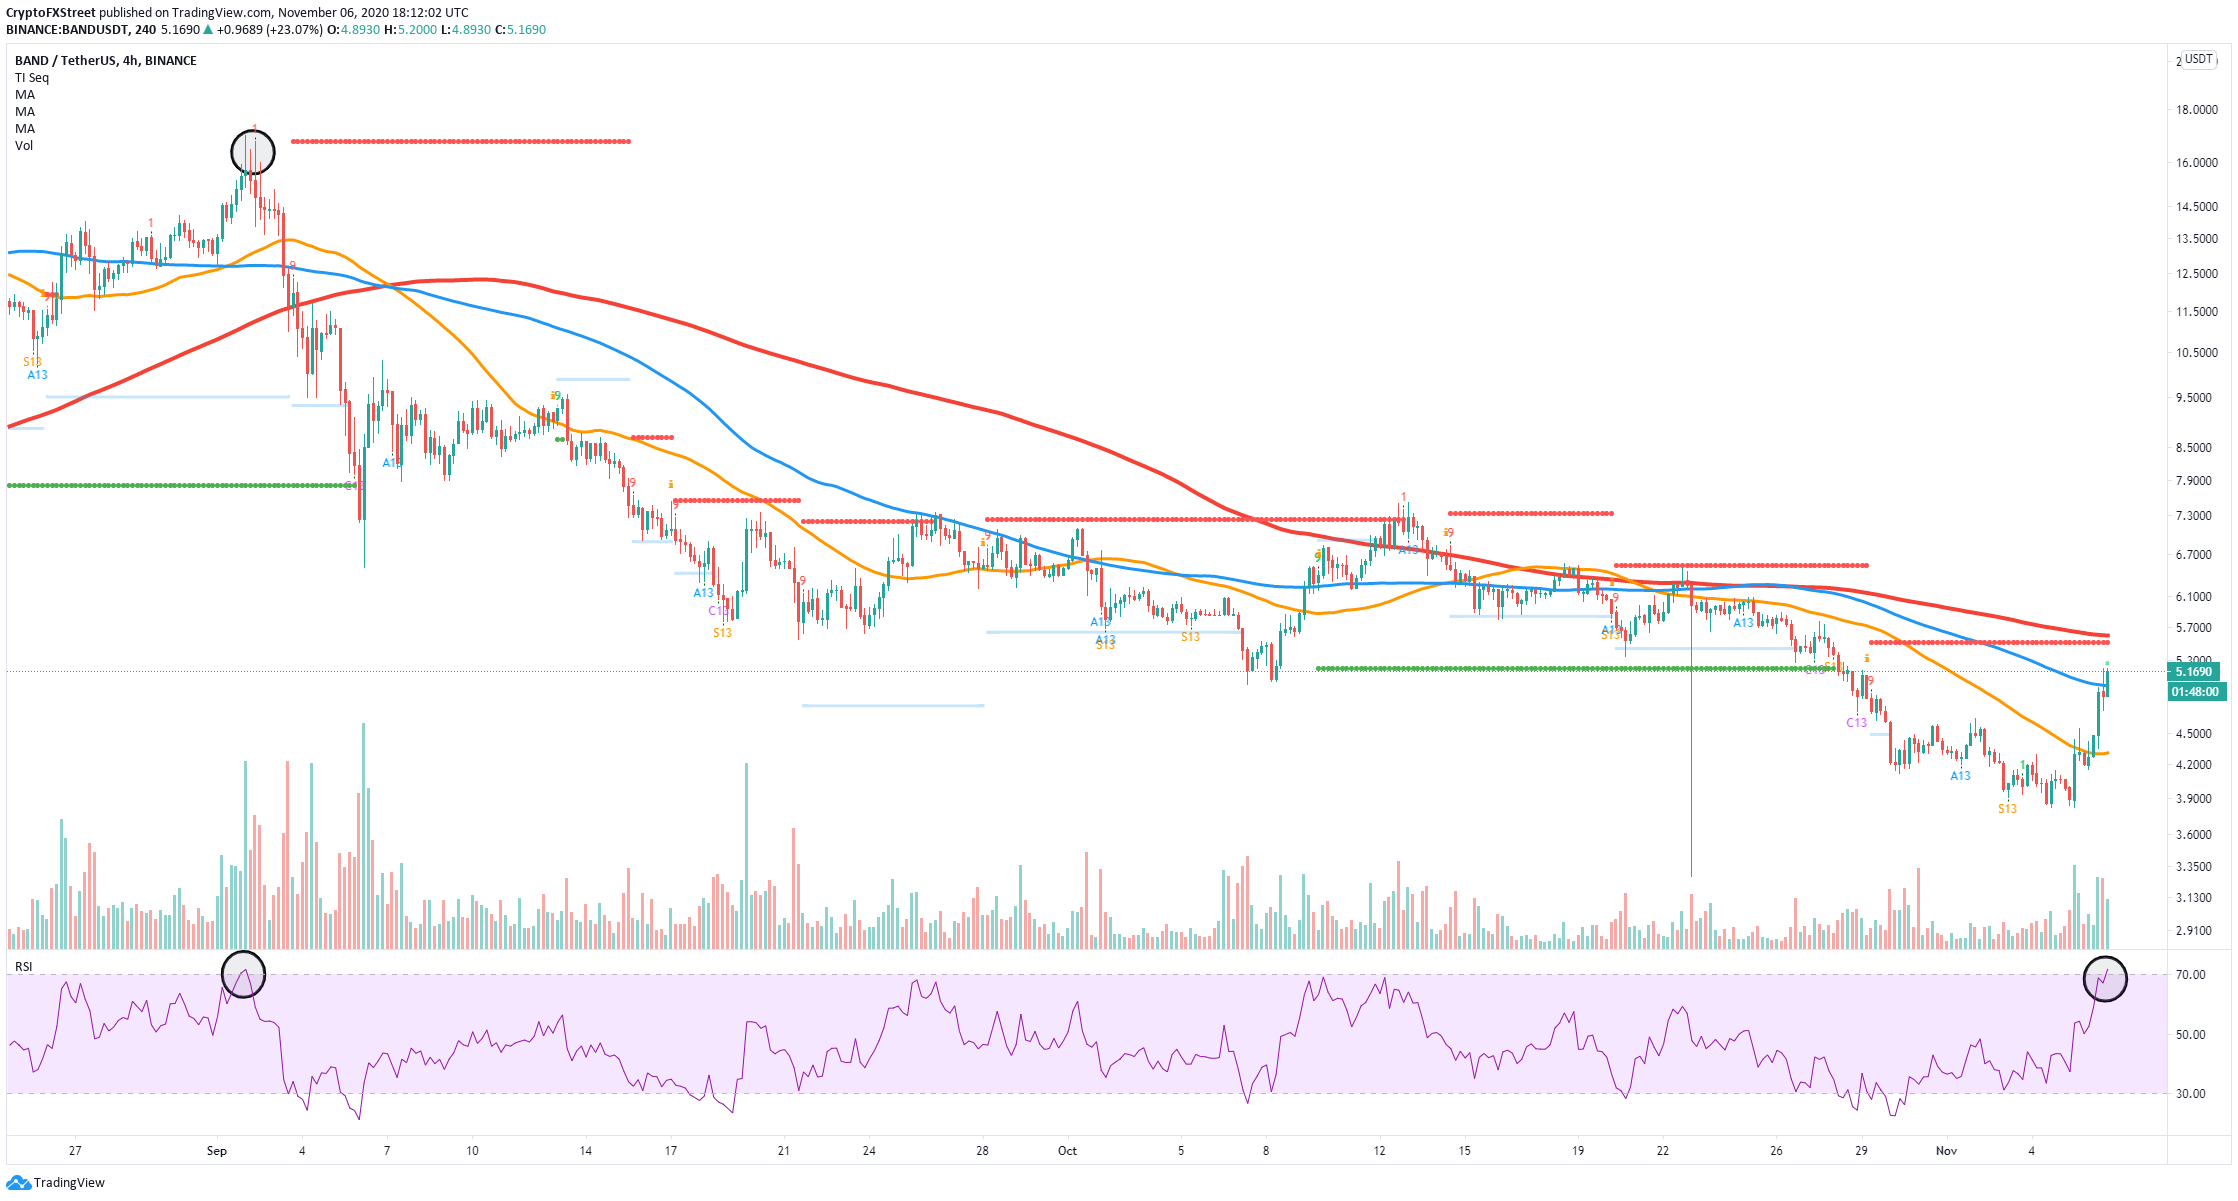
BAND/USDT 4-hour chart

On September 2, BAND's price dropped by more than 60% within the next week after the RSI got overextended. Validation of the sell signal in conjunction with the RSI can drive BAND's price towards the 50-SMA at $4.30.
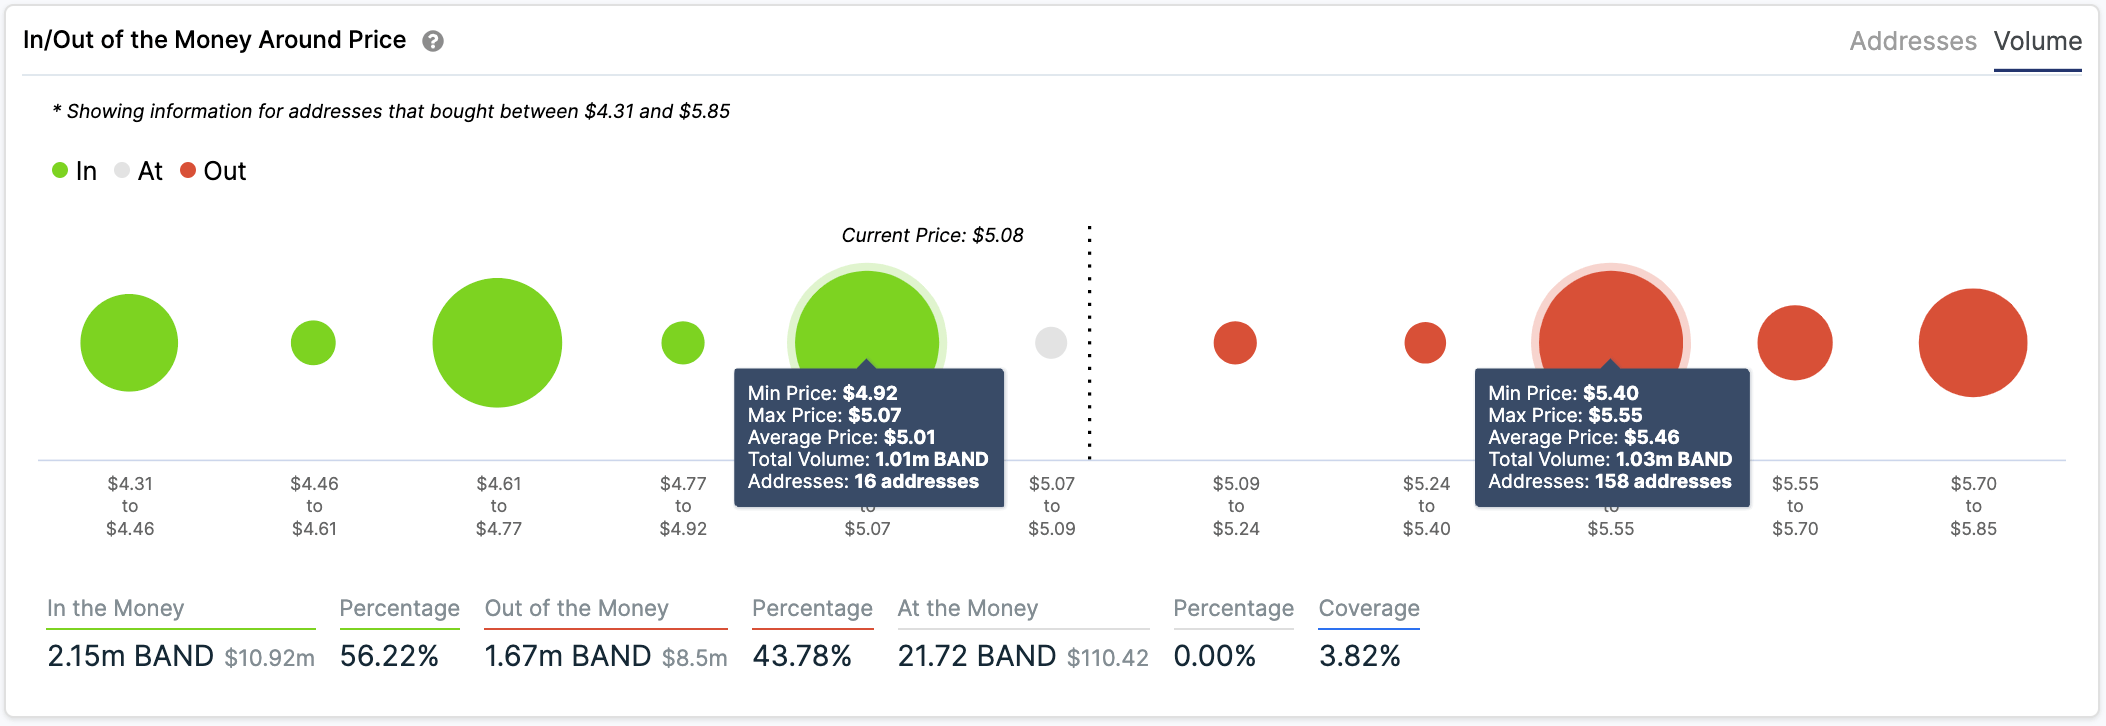
band price

BAND IOMAP chart

Despite the strong sell signals, the IOMAP chart shows that BAND still has some more room for growth before a pullback. The resistance area between $5.4 and $5.55, where 158 addresses purchased 1.03 million BAND seems to be the most significant range.

Looking at the 4-hour chart, it seems that the range described above coincides with the 200-SMA, which is located at $5.6, which means this level is a potential bullish price target in the short-term. Additionally, the IOMAP chart also shows a strong support range between $4.92 and $5.07. 

Author

Lorenzo Stroe

Lorenzo Stroe

Independent Analyst

Lorenzo is an experienced Technical Analyst and Content Writer who has been working in the cryptocurrency industry since 2012. He also has a passion for trading.

More from Lorenzo Stroe
Share:

Editor's Picks

Bitcoin slips below $75,000 as selling pressure accelerates

Bitcoin (BTC) price falls below the $75,000 mark on Monday, having corrected nearly 11% in the previous week and reaching level not seen in nearly 10 months. Market momentum has clearly turned bearish, with technical indicators pointing to further downside toward the next key support at $70,000.

Top 3 Price Prediction: Bitcoin, Ethereum, and Ripple weakness persists after massive correction

Bitcoin, Ethereum and Ripple trade in red on Monday after dipping by over 11%, 19% and 13%, respectively, in the previous week. The top three cryptocurrencies have shed 10%, 17%, and 10.5% in the first month of 2026, highlighting persistent downside pressure.

Top Crypto Losers: Monero, Ethereum, and Kaspa face intense sell-off

Altcoins, including Monero, Ethereum, and Kaspa, are leading the broader cryptocurrency market decline with a steep correction on Sunday. Monero and Ethereum are close to critical support levels near $400 and $2,300, respectively.

Solana Price Forecast: SOL slips below $100, risks deeper correction

Solana (SOL) price extends its correction, trading below $100 on Monday after losing more than 15% in the previous week. The bearish price action is further backed by derivatives data, which shows rising short bets and negative funding rates.

Bitcoin Price Annual Forecast: BTC holds long-term bullish structure heading into 2026

Bitcoin (BTC) is wrapping up 2025 as one of its most eventful years, defined by unprecedented institutional participation, major regulatory developments, and extreme price volatility.

Bitcoin: BTC correction deepens as Fed stance, US-Iran risks, mining disruptions weigh

Bitcoin (BTC) price extends correction, trading below $82,000 after sliding more than 5% so far this week. The bearish price action in BTC was fueled by fading institutional demand, as evidenced by spot Exchange-Traded Funds (ETFs), which recorded $978 million in inflows through Thursday.