AXS price sows doubt, yet Axie Infinity has the swagger for higher prices
- AXS price enters corrective process after striking the measured move target of the cup base.
- Axie Infinity plots doji candlesticks along the 461.8% Fibonacci extension level of the April-May correction, suggesting indecision.
- Altcoin reaches the greatest deviation from the 50-day simple moving average (SMA), easily surpassing mid-July levels.

AXS price climbed 183.75% from May 21 to May 23, easily besting any previous three-day rally since 2020 and carry the cryptocurrency to the 461.8% extension of the April-May correction. Over the last ten days, Axie Infinity has fallen -6.23%, leaving doubt about the potential to continue the advance moving forward. However, as long as AXS price remains above the 38.2% retracement level at $35.94 on a daily closing basis, it is primed for higher prices.
AXS price needs time to digest 1,800% gain over the last month
AXS price achieved one of the most dominant performances from the end of June to the end of July, carrying the altcoin to a 1,800% gain and a test of the 461.8% extension of the April-May correction and the measured move target of the cup base formed from April to July. The presence of several doji candlestick patterns along the highs distinctly highlights the indecision and uncertainty that currently underpins Axie Infinity.
The waning bid is visible on the six-hour chart when a bearish momentum divergence triggered on July 27 as the Relative Strength Index (RSI) did not confirm the price with a new high. The result has been the ongoing corrective process and test of the 50 six-hour SMA, where Axie Infinity currently trades.
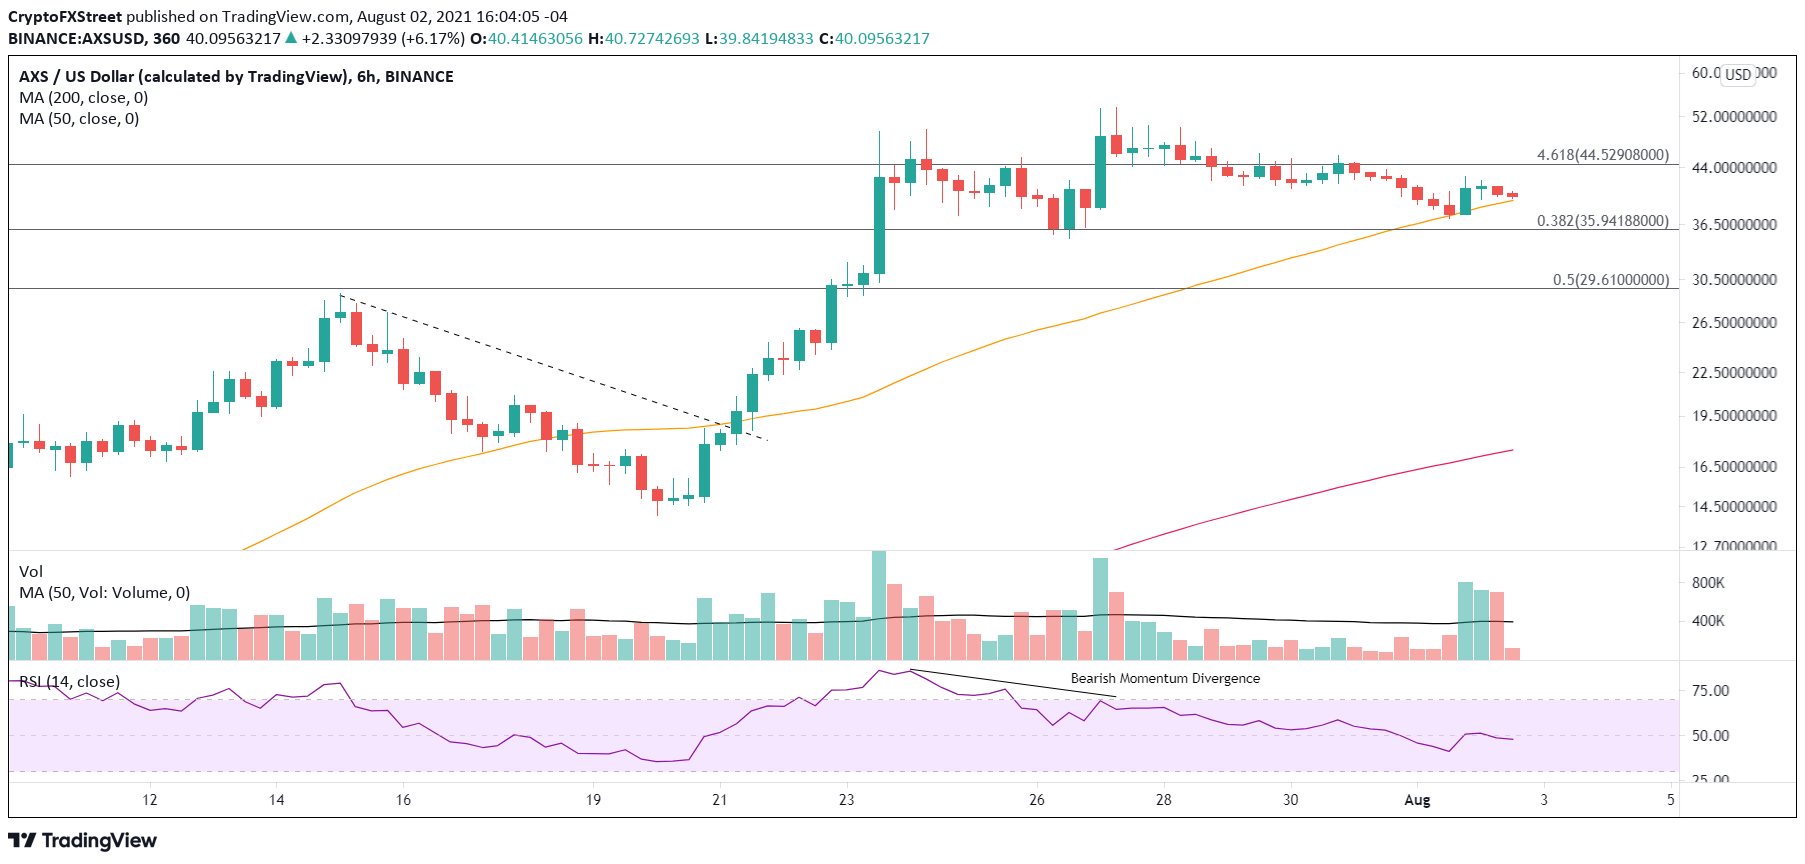
AXS/USD 6-hour chart
The evident indecision plotted on the daily chart does not automatically confirm a top has been printed, and AXS price is in the early stages of a deeper correction. When Axie Infinity tested the 261.8% extension of the April-May correction at $26.40, the cryptocurrency immediately entered a corrective process that bottomed before the 38.2% retracement of the advance that began on June 22.
Hence, the touch of the 461.8% extension combined with the completion of the measured move is an obvious point for consolidating the advance. As of today, the weakness has not pushed AXS price below the 38.2% retracement level of the advance from the June 22 low of $2.78. Adding to the correction narrative is the notable contraction in Axie Infinity volume over the previous five down days, indicating there is no rush for the exits.
Moving forward, if AXS price can record a daily close above the June 27 high of $56.44, there is a high probability that Axie Infinity is poised for higher prices. The upside potential includes continuing the advance to the topside trend line going back to the November 2020 high at $121.40, generating a 115% return from the June 27 high and over 200% from the current price.
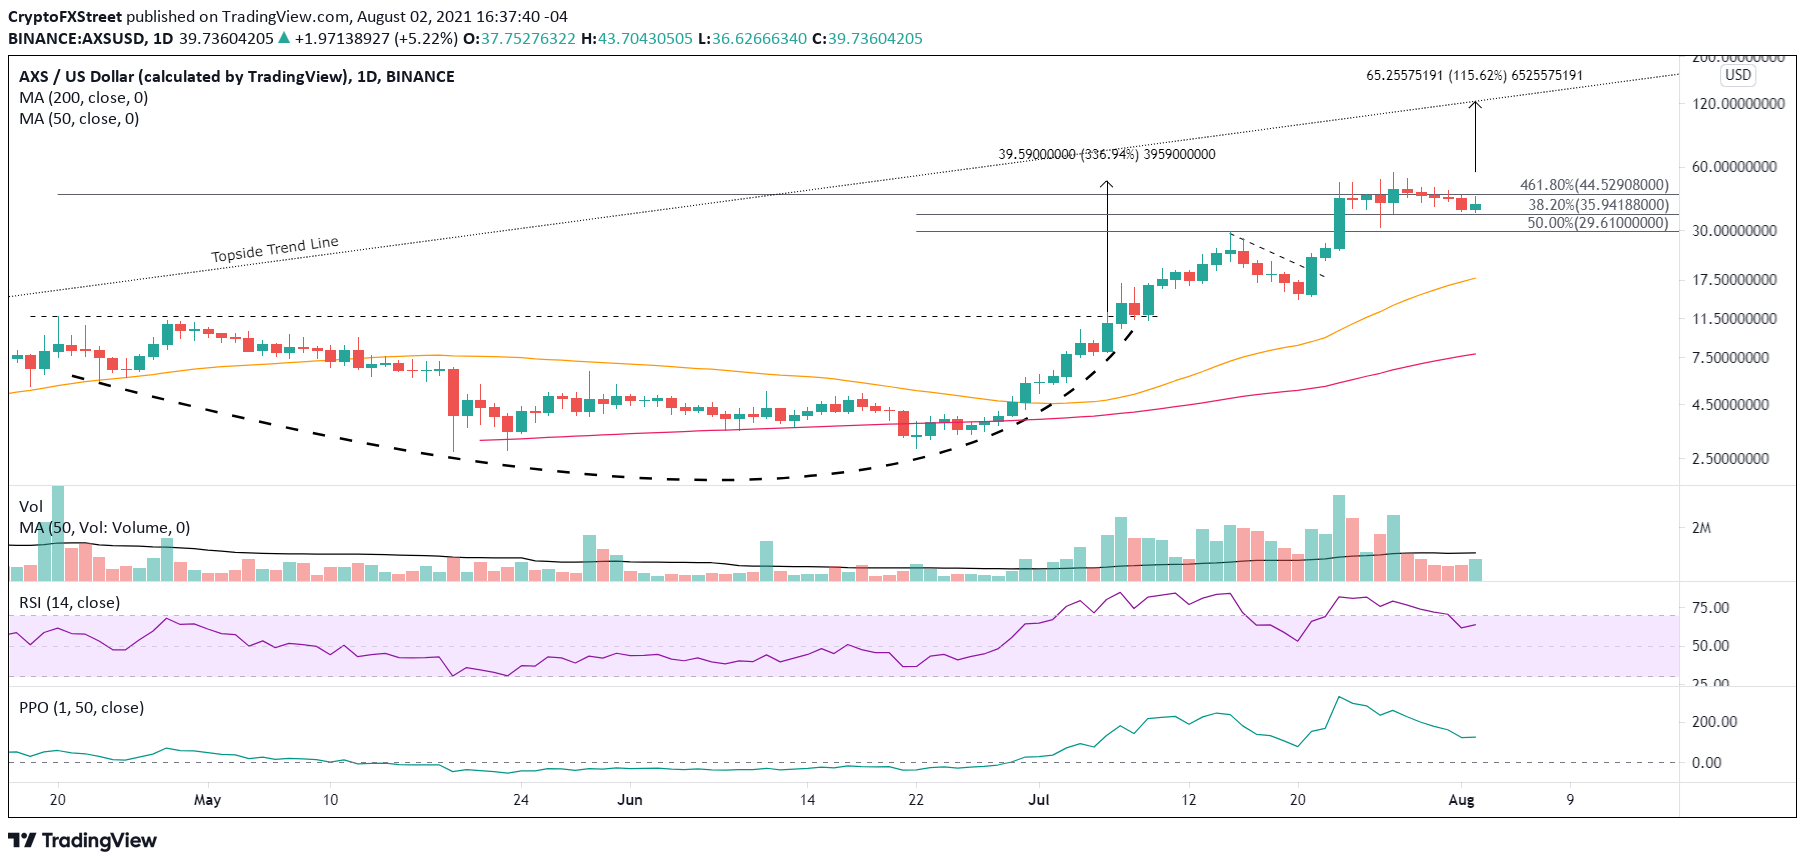
AXS/USD daily chart
A failure to hold the 38.2% retracement at $35.94 on a daily closing basis will at least introduce a deeper correction to the 50% retracement and potentially confirm a significant top in AXS price.
Whether AXS price can reach the topside trend line is a tough call, but it has not provoked a need to panic during this consolidation. Instead, Axie Infinity has opted for a drift lower, clearing the weak holders, releasing the price compression, allowing the 50-day SMA to play catch-up and generating the base for a renewal of the tremendous advance since the June low. Everything points to a digital token that has not lost its swagger.
Here, FXStreet's analysts evaluate where AXS could be heading next as it looks primed for consolidation before higher highs.
Author

Sheldon McIntyre, CMT
Independent Analyst
Sheldon has 24 years of investment experience holding various positions in companies based in the United States and Chile. His core competencies include BRIC and G-10 equity markets, swing and position trading and technical analysis.



