AXS Price Prediction: Axie Infinity may be on the brink of a 30% decline
- AXS price is up 317% for the month, marking the best monthly return since data going back to November 2020.
- Axie Infinity six-hour Relative Strength Index (RSI) flashing a bearish momentum divergence with the price.
- 261.8% Fibonacci extension of the April-May correction is approximately 10% away from the current price, offering a new challenge.

AXS price has displayed incredible relative strength since the June 22 low, outpacing all of the cryptocurrencies on the watchlist by a sizable margin. The resulting overbought condition and elevation to an important Fibonacci extension level introduce some doubt about the rally’s sustainability from the current price. It is time to contemplate a minor correction for Axie Infinity to release the price compression in the coming days.
AXS price meets technical warning signs as rally extends
Axie Infinity has exploded onto the scene with a feverish rally of 760% since the June 22 low of $2.78. In fact, there have been only four down days over the 22 days, with the worst loss coming in at just -11%. Due to the velocity of the AXS price advance, the daily RSI has sustained extreme oversold readings since July 7.
It is a remarkable development in the cryptocurrency market and an interesting story for a protocol that draws inspiration from CryptoKitties. As outlined in an FXStreet article on July 13, Axie Infinity “is a blockchain-based trading and breeding game that is built on the Ethereum blockchain.” Key to its widespread adoption has been the friendly and popular free-to-play model that has enabled it to climb past PancakeSwap and other notable dApps in terms of cumulative revenue.
The compelling fundamental story and the resulting AXS price advance have carried the digital token near the significant 261.8% Fibonacci extension level of the April-May correction at $26.40. It is a new technical challenge for Axie Infinity and maybe the only one since the breakout above the previous all-time high of $11.75.
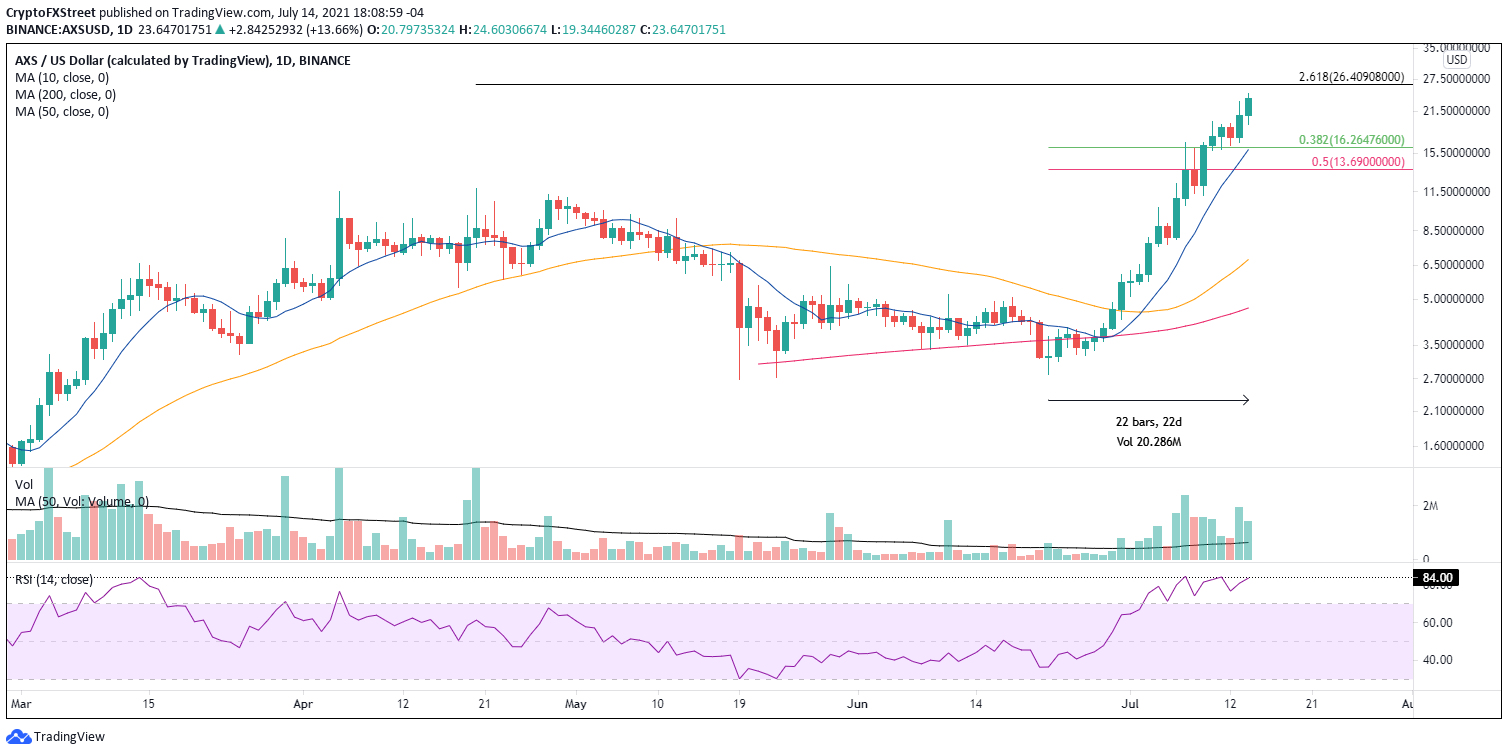
AXS/USD daily chart
The emerging bearish momentum divergence on the six-hour chart adds to the potential for an AXS price setback. The RSI does not confirm the recent price highs, suggesting that the Axie Infinity advance’s momentum is waning. Fading momentum is always discovered on the intra-day timeframes before it manifests in the daily chart, but the momentum divergence is not an explicit sell signal.
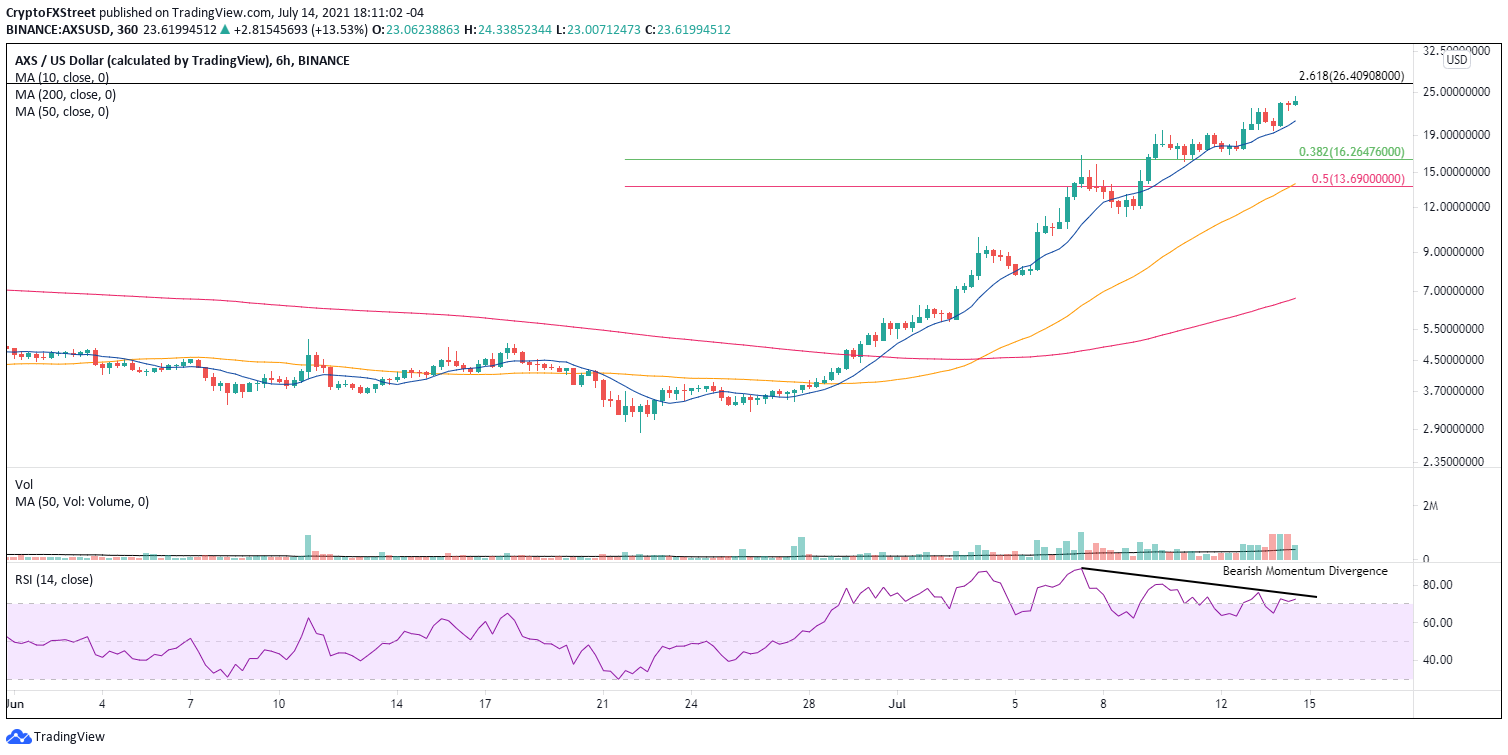
AXS/USD 6-hour chart
At this point, there is no definitive sell signal unless AXS price tags the 261.8% extension level now. However, suppose Axie Infinity does commence a corrective process. In that case, there will be substantial support at the intersection of the 38.2% retracement level of the June-July rally at $16.26, with the 10-day simple moving average (SMA) at $15.98 representing a 36% fall from the current price. A failure to hold that range would introduce the potential for a test of the 50% retracement level at $13.69.
It is a challenge to call tops, but the emergence of the 261.8% extension level combined with the building momentum divergence on the intra-day timeframes does begin to stack the probabilities in favor of at least a mild Axie Infinity correction. The exact timing remains fluid.
Author

Sheldon McIntyre, CMT
Independent Analyst
Sheldon has 24 years of investment experience holding various positions in companies based in the United States and Chile. His core competencies include BRIC and G-10 equity markets, swing and position trading and technical analysis.


