Axie Infinity Price Prediction: An explosive move to come one way or another
- Axie Infinity rose by 132% in January, reaching a new YTD high of $13.94.
- Technical indicators show mixed signals, with the potential for a 28% decline towards $7.30 or a possible 70% increase towards $17.
- A breach above the $13.94 zone would reduce the bearish potential.

Axie Infinity price is one to watch as it shows short-term bearish potential within a larger bullish narrative. Key levels have been defined to gauge the next potential swing.
Axie infinity price nears a big move
Axie Infinity price has experienced a surge of volatility, with a 132% increase since January 1. After establishing a new YTD high at $13.94, the market has been consolidating near the $13.00 zone for the past three weeks. At the time of writing, The AXIE price is down 5% this week.
Axie Infinity price currently auctions at $12.78, as technical indicators show mixed signals for the future ahead. For instance, the Relative Strength Index breached overbought conditions during the 132% rally, which is a bullish cue. However, the Volume Indicator shows the largest amount of transactions occurring on a red day this year, which happened on January 23. Additionally, the February 9 candlestick was the largest red day of 2022, causing a 15% decline. During this downswing, the bears breached both the 8-day exponential moving average and the 21-day simple moving average.
Considering these factors, the midpoint of the winter rally has a fair chance of being breached, leading to a potential 28% decline toward the $7.30 zone. The uptrend, which originated near the $6.00 zone, should remain intact unless the RSI falls below 40 on the daily time frame.
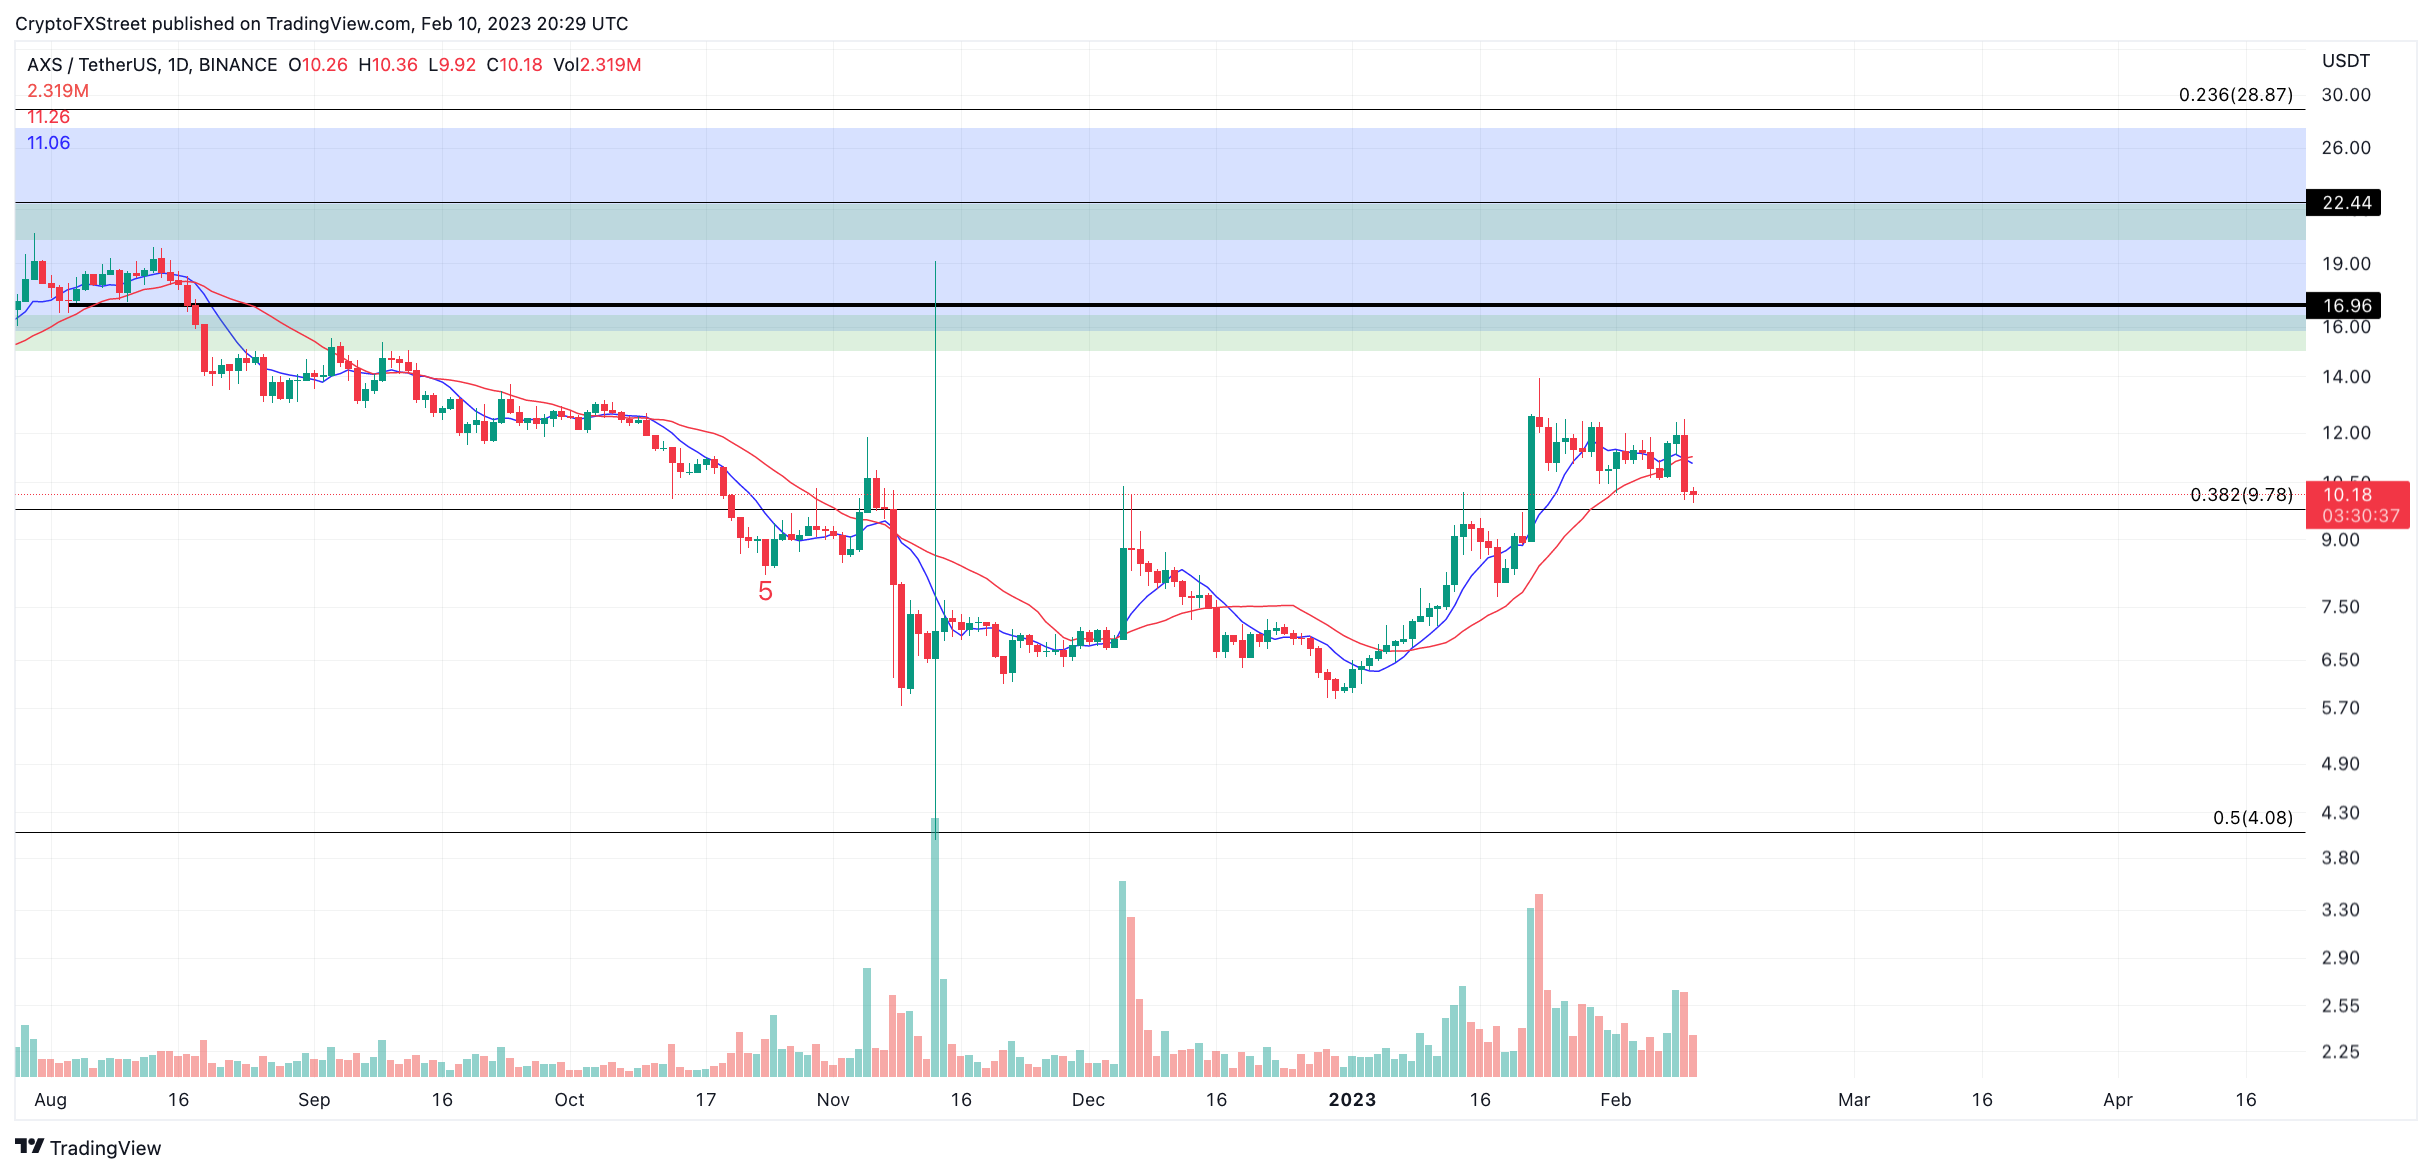
AXS/USDT 1-Day Chart
On the other hand, invalidation of the bearish thesis could occur if the bulls can hurdle the newly established YTD high of $13.94. In doing so, the bulls could continue the winter rally and challenge liquidity levels in the $17 region. Axie Infinity price would increase by 70% from its current market value if the bulls were to succeed.
Author

Tony M.
FXStreet Contributor
Tony Montpeirous began investing in cryptocurrencies in 2017. His trading style incorporates Elliot Wave, Auction Market Theory, Fibonacci and price action as the cornerstone of his technical analysis.


