Axie Infinity price headed for a 13% plunge if key support level fails to hold
- Axie Infinity price could be awaiting a 13% decline as the token approaches a critical level of support.
- If AXS slices below $75.07, the token could be at risk of dropping toward $66.61.
- A foothold may emerge at $72.20 before Axie Infinity falls further.

Axie Infinity price is at risk of sliding lower if a crucial support barrier fails to hold. Slicing below $75.07 could spell trouble for the bulls as a governing technical pattern projects a 13% plunge toward $66.61.
Axie Infinity bears target toward $66 next
Axie Infinity price has formed a rising wedge pattern on the 4-hour chart, suggesting a bearish narrative for the token. AXS is currently nearing a critical line of defense at the lower boundary of the prevailing chart pattern at $75.07.
If Axie Infinity price slices below the aforementioned level of support, a 13% move to the downside toward $66.61 would be on the radar.
AXS may slide lower toward the 50 four-hour Simple Moving Average (SMA) at $74.34 as another line of defense, before dropping toward the 78.6% Fibonacci retracement level at $72.20, sitting near the support line given by the Momentum Reversal Indicator (MRI).
Additional selling pressure may see Axie Infinity price fall toward the January 9 low at $68.86 before AXS reaches the bearish target given by the prevailing chart pattern at $66.61, which coincides with the September 19 high.
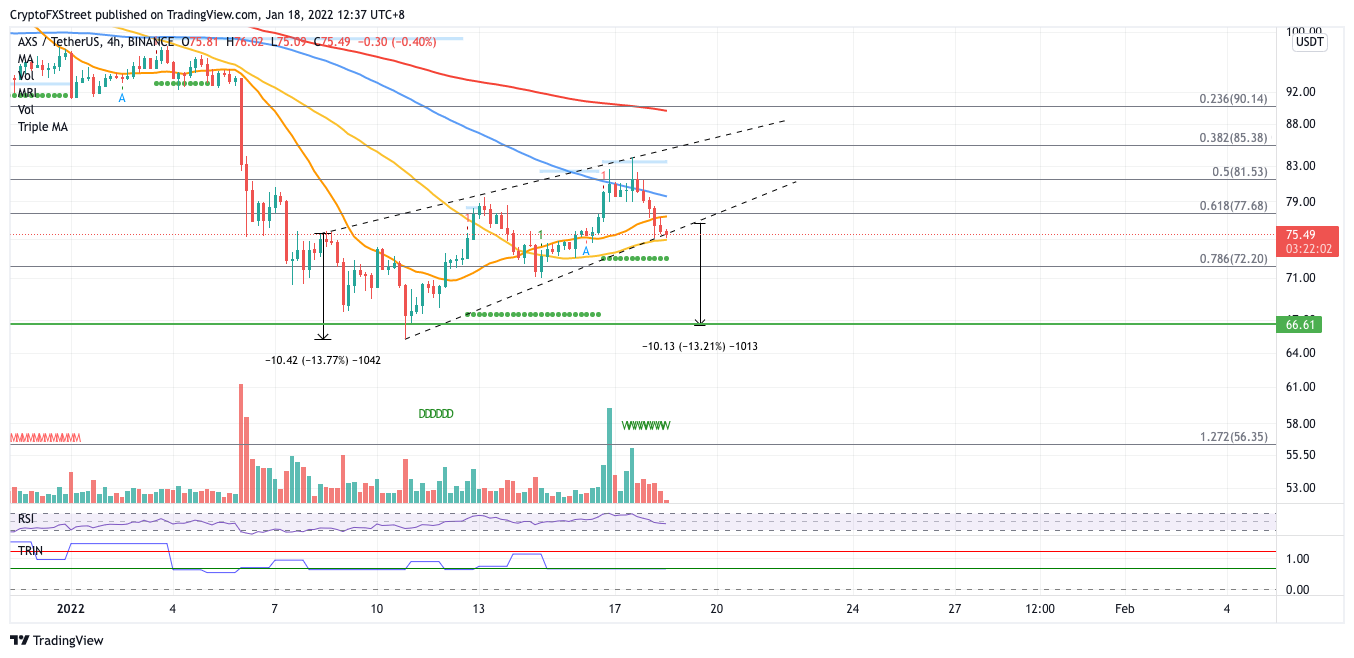
AXS/USDT 4-hour chart
However, if the bulls manage to reverse the period of underperformance, the first line of resistance sits at the 61.8% Fibonacci retracement level at $77.68, coinciding with the 21 four-hour SMA.
Axie Infinity price may meet further obstacles at the 100 four-hour SMA at $79.47, then at the 50% retracement level at $81.53 before the buyers target the upper boundary of the governing technical pattern at $85.53, where the 38.2% Fibonacci retracement level also sits.
Author

Sarah Tran
Independent Analyst
Sarah has closely followed the growth of blockchain technology and its adoption since 2016.




