Aster Price Forecast: ASTER’s V-shaped reversal hits key resistance
- Aster rebounds to a key resistance trendline, with bulls eyeing a potential breakout rally.
- A decline in bearish sentiment among retail derivative traders bolsters Aster’s recovery.
- Aster increases utility as collateral with an 80% margin, which could boost the bullish positions in the perpetuals market.

Aster (ASTER) ticks higher by 4% at press time on Thursday, marking its third day of uptrend to challenge a local resistance trendline. A positive shift in retail sentiment, with the utility expansion serving as collateral on its native derivatives trading platform, featuring an 80% margin ratio, could catalyze a trendline breakout rally.
Aster’s utility update and the shift in retail sentiment
Aster, a perpetuals-focused Decentralized Exchange (DEX), announced the expansion of its native token, ASTER, as collateral with an 80% margin ratio, which refers to the loan-to-value ratio. With the leverage available on the Aster perpetual, a positive shift is visible in the traders’ sentiment.

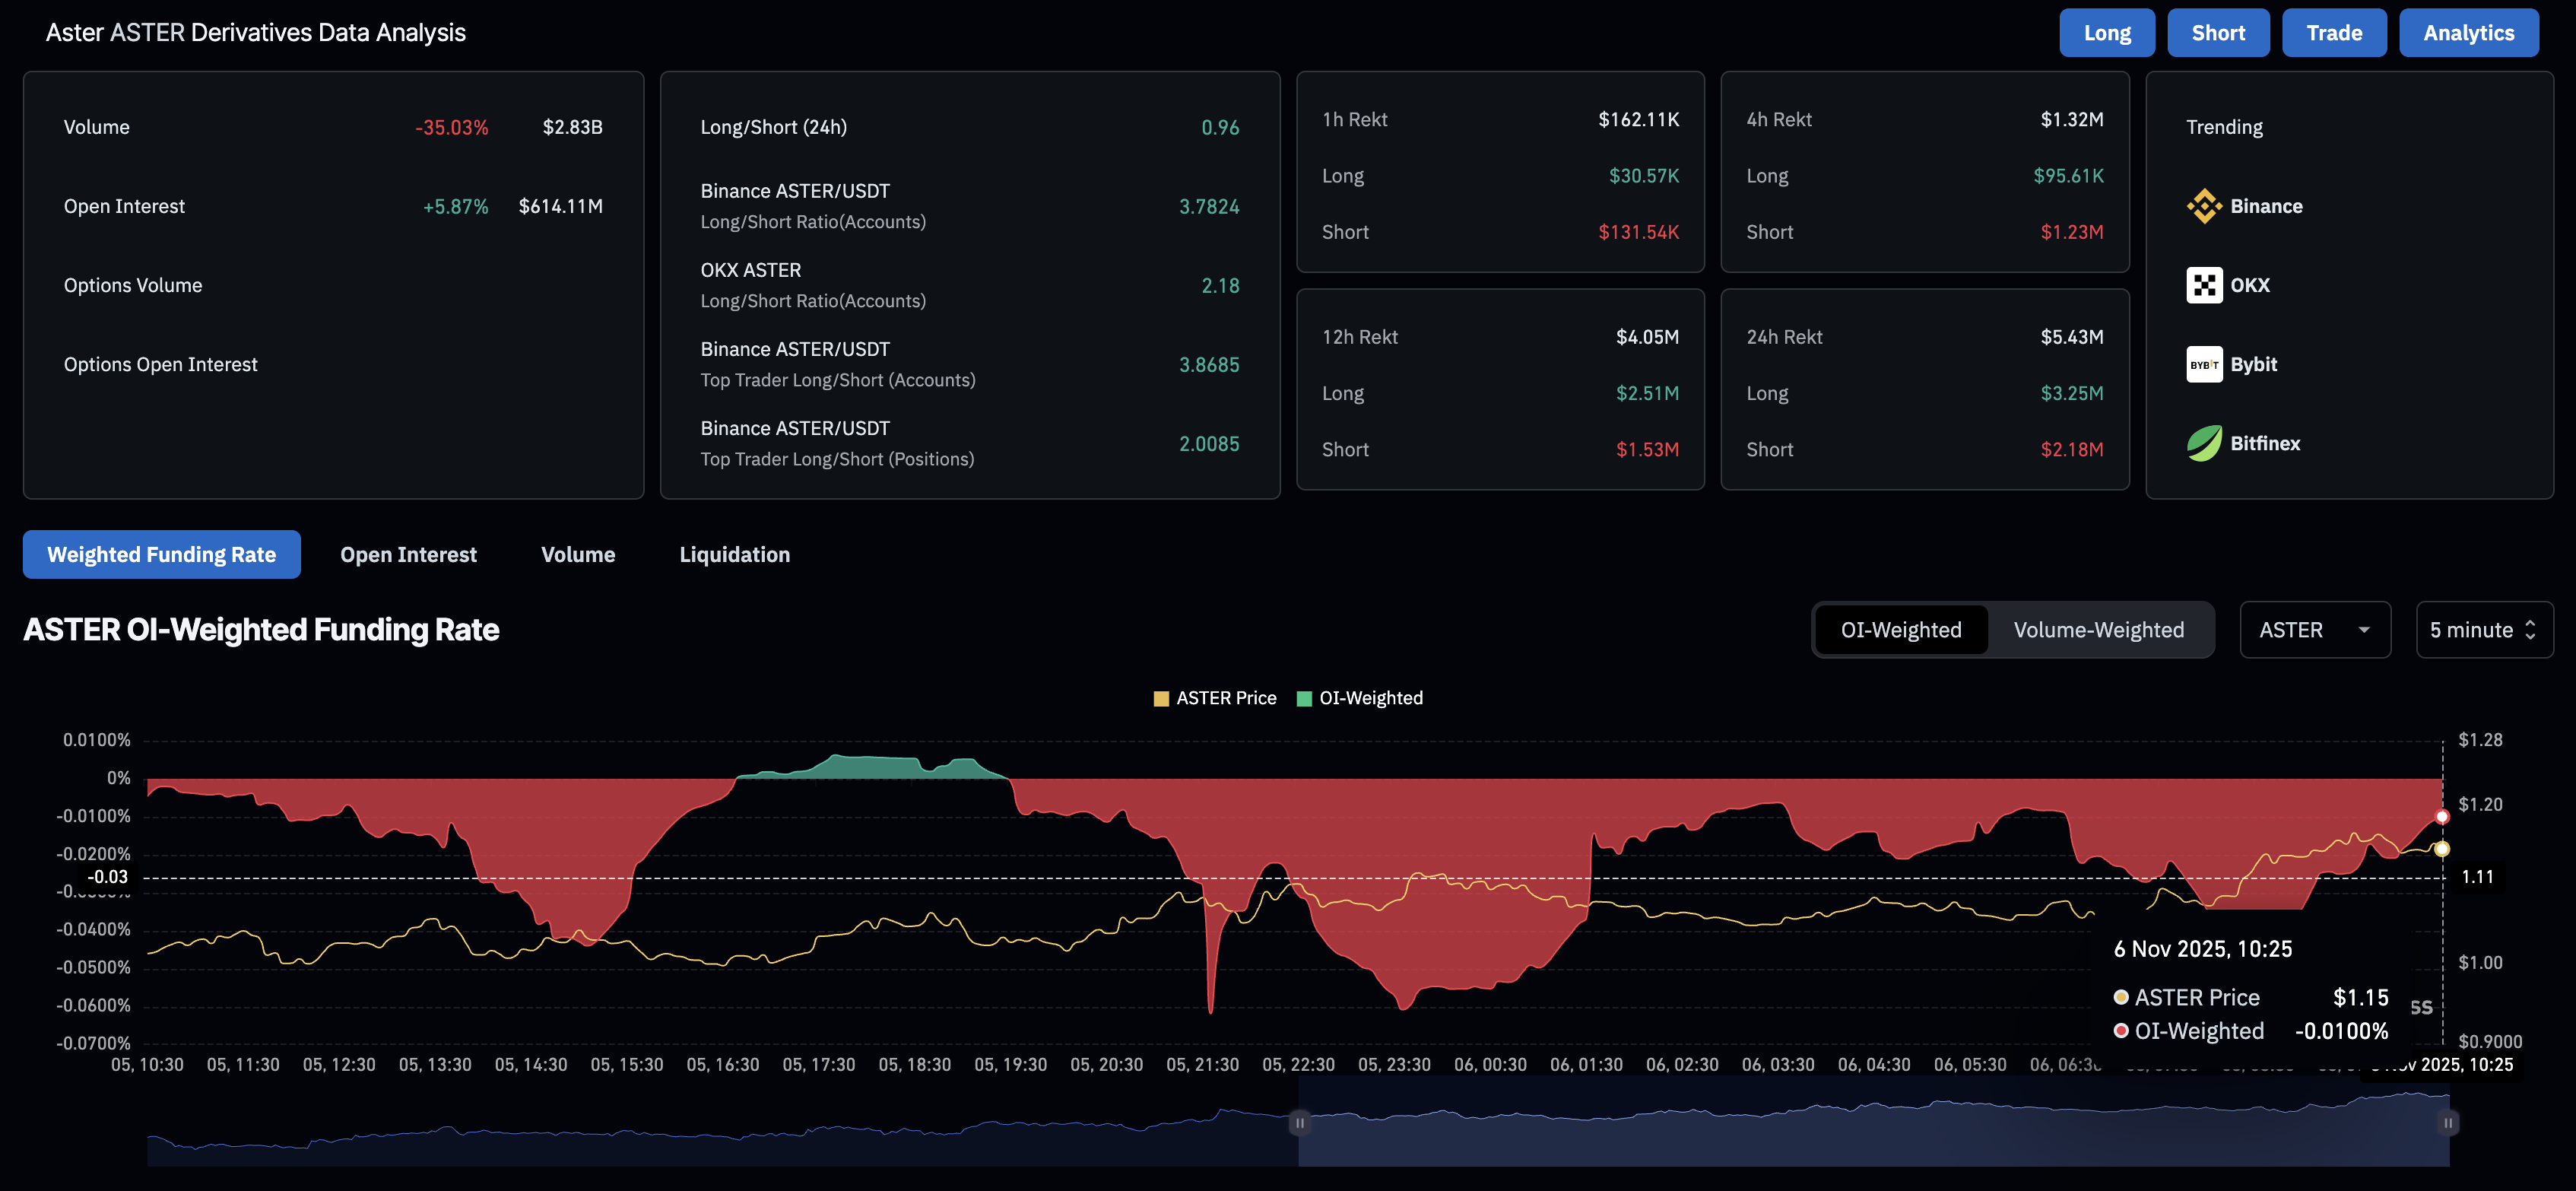
CoinGlass data shows a 5.87% increase in ASTER futures Open Interest (OI) over the last 24 hours, indicating a buildup of long positions. Furthermore, the OI-weighted funding rate stands at -0.0100%, up from -0.0423% earlier in the day, indicating a decline in traders' sentiment to pay a premium for bearish positions.
Aster’s recovery hits a key resistance trendline
Aster trades above the 100-period Exponential Moving Average on the 4-hour chart, challenging a local resistance trendline, near $1.1500, formed by connecting the swing highs from October 6 and November 2.
If Aster marks a decisive close above this level, it could confirm an upside breakout of the trendline, extending the rally to the $1.2977 level marked by the October 14 low.
The technical indicators on the 4-hour chart indicate a steady rise in buying pressure, as the Moving Average Convergence Divergence (MACD) remains in an uptrend after crossing above the zero line on Wednesday. Furthermore, the upward trend in the Relative Strength Index (RSI) has reached 60, indicating increasing bullish momentum still below the overbought zone.
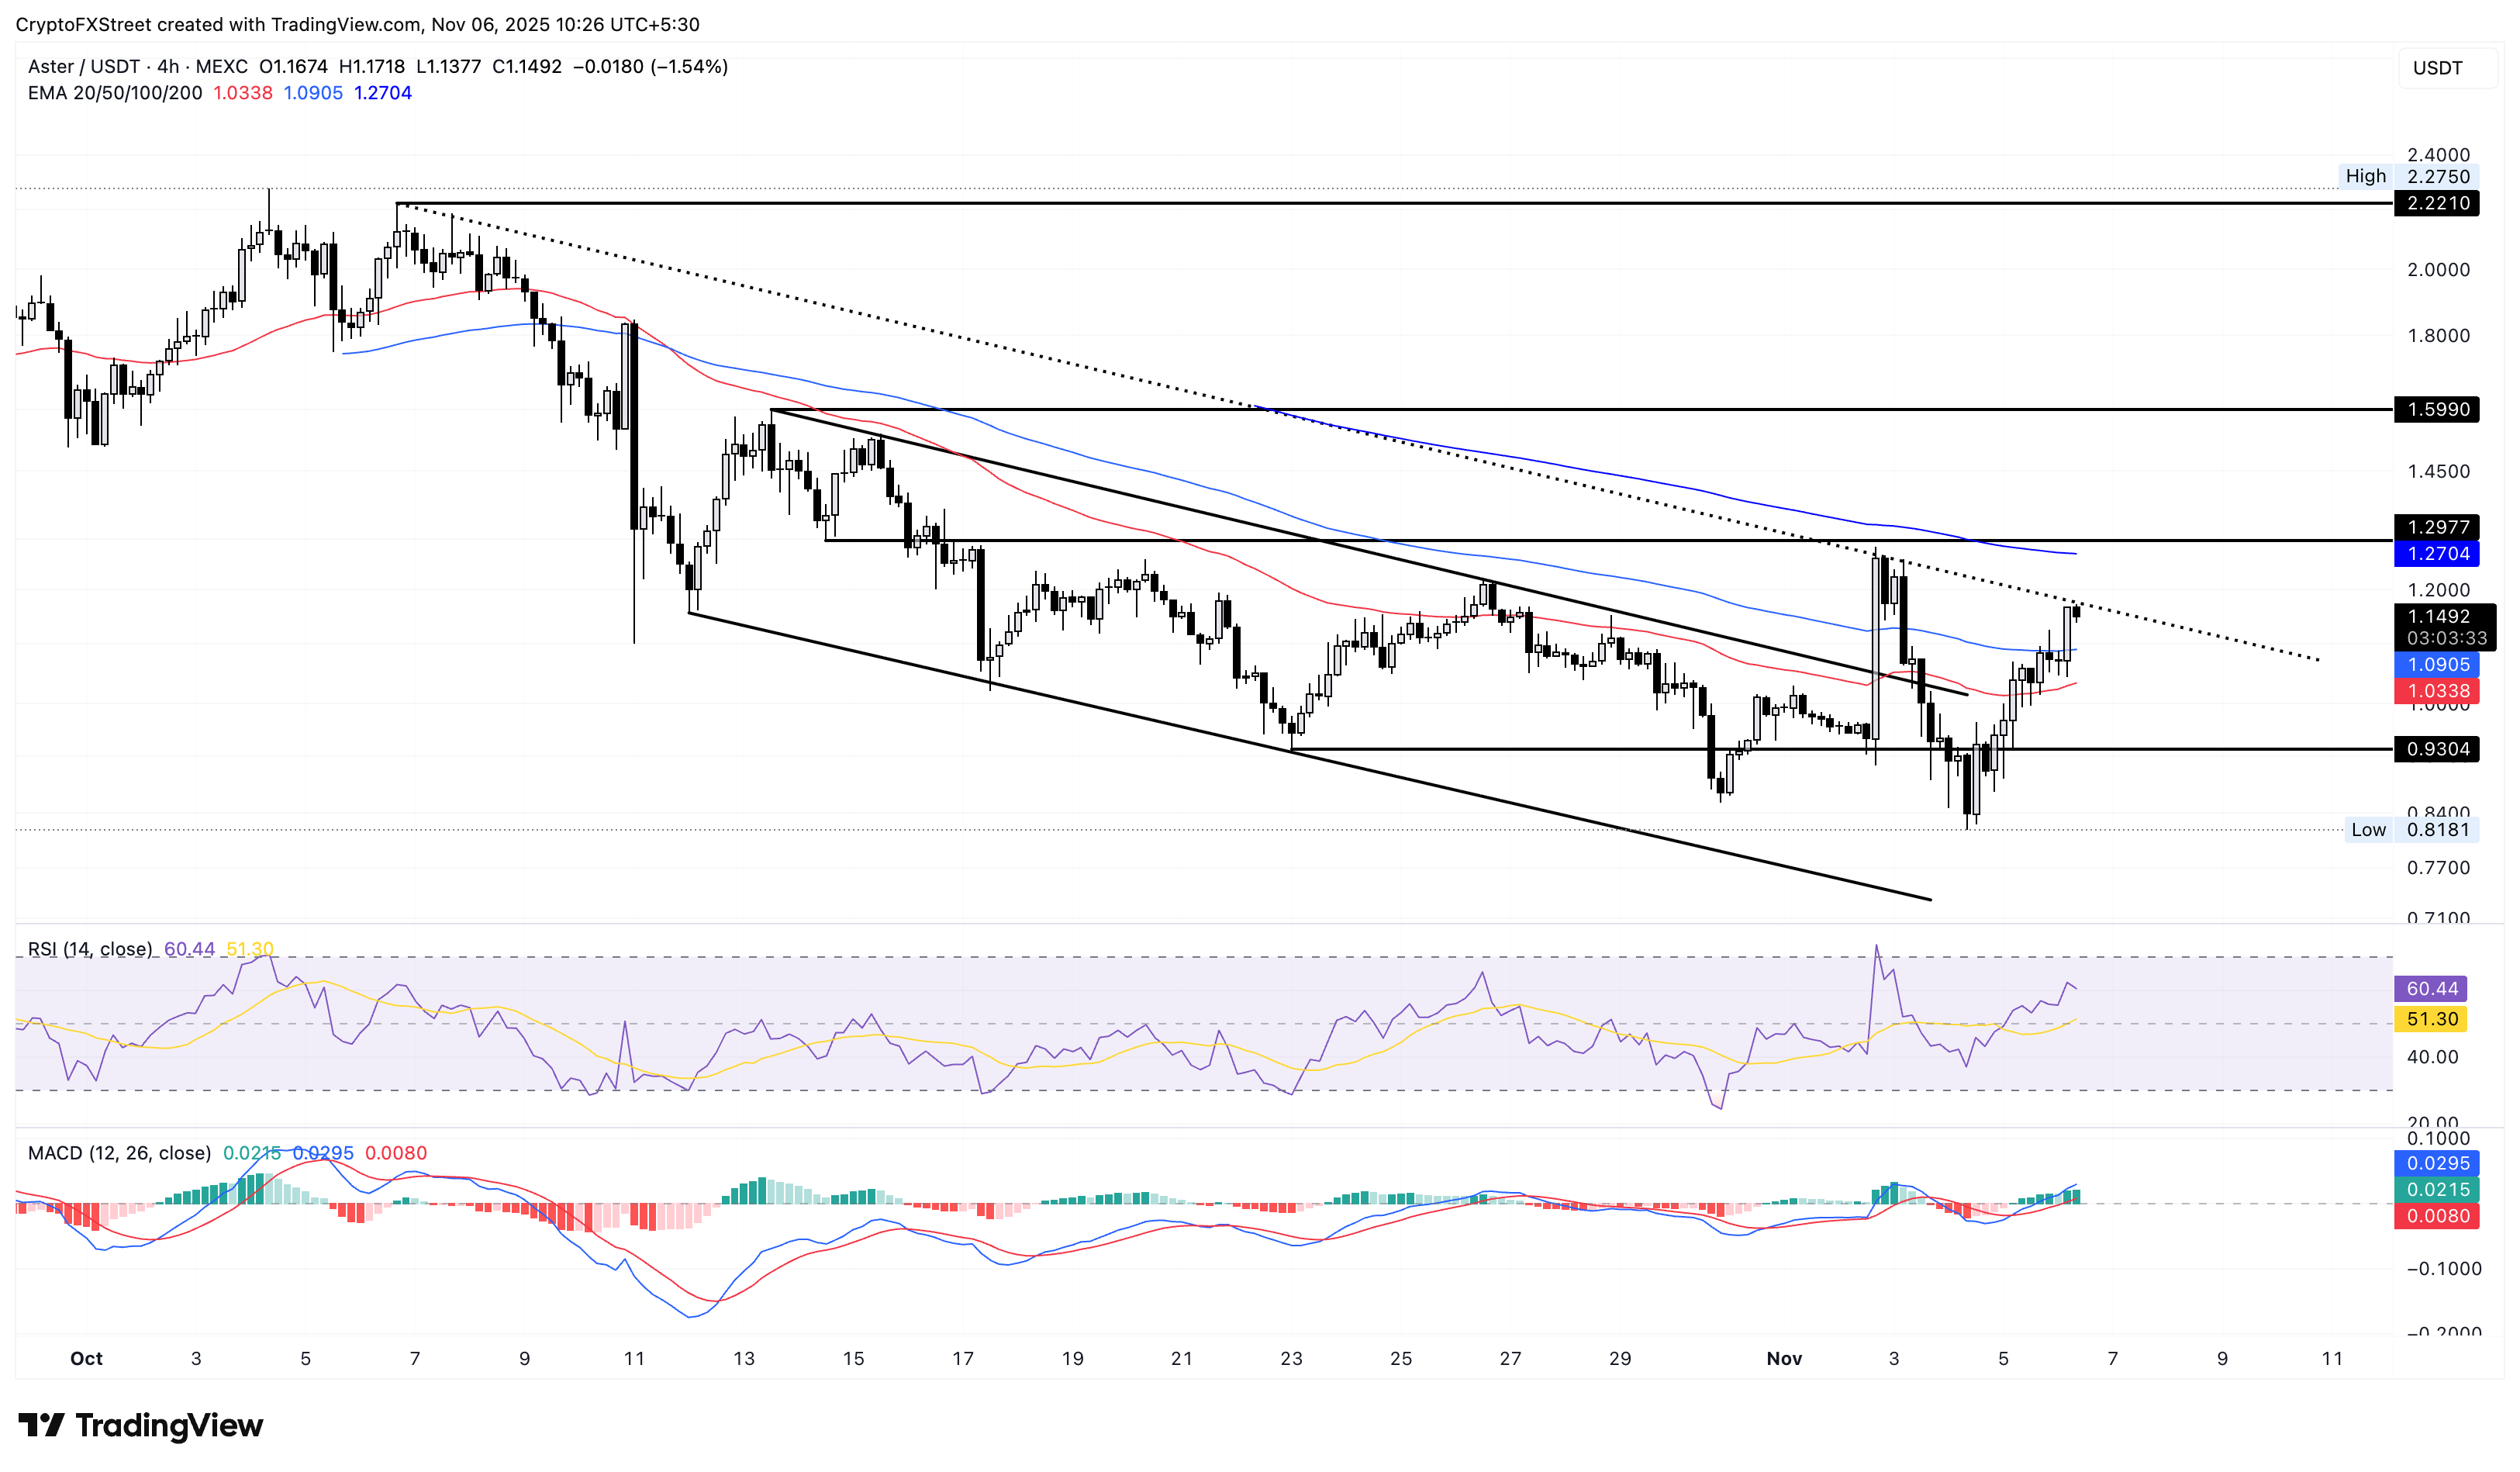
Looking down, if a reversal from the trendline marks a close below the 50-period EMA at $1.0338, the $1.0000 psychological mark and the October 22 low at $0.9304 could act as key support levels.
Author

Vishal Dixit
FXStreet
Vishal Dixit holds a B.Sc. in Chemistry from Wilson College but found his true calling in the world of crypto.



