Algorand Price Forecast: ALGO eyes over 10% increase as it nears breakout from wedge pattern
- Algorand’s sudden recovery on Sunday, which holds on Monday, nears a potential reversal from the current downtrend.
- Long positions have held at 52% over the last 24 hours, indicating buy-side dominance.
- The technical outlook suggests a recovery in bullish momentum, increasing the chances of a breakout from a wedge pattern.

Algorand (ALGO) edges higher by 1% at press time on Monday, extending the 7% jump from Sunday, as both technical and derivatives data suggest extended gains if ALGO breaks out from a wedge pattern.
Capital inflows remain muted even as bullish bets increase
Algorand traders in the derivatives market anticipate a further recovery as the long-to-short ratio shows a buy-side dominance.
CoinGlass data shows that the long positions over the last 24 hours have remained at 52%, with a long-to-short ratio of 1.0991, indicating a bullish imbalance in the number of active derivative contracts.
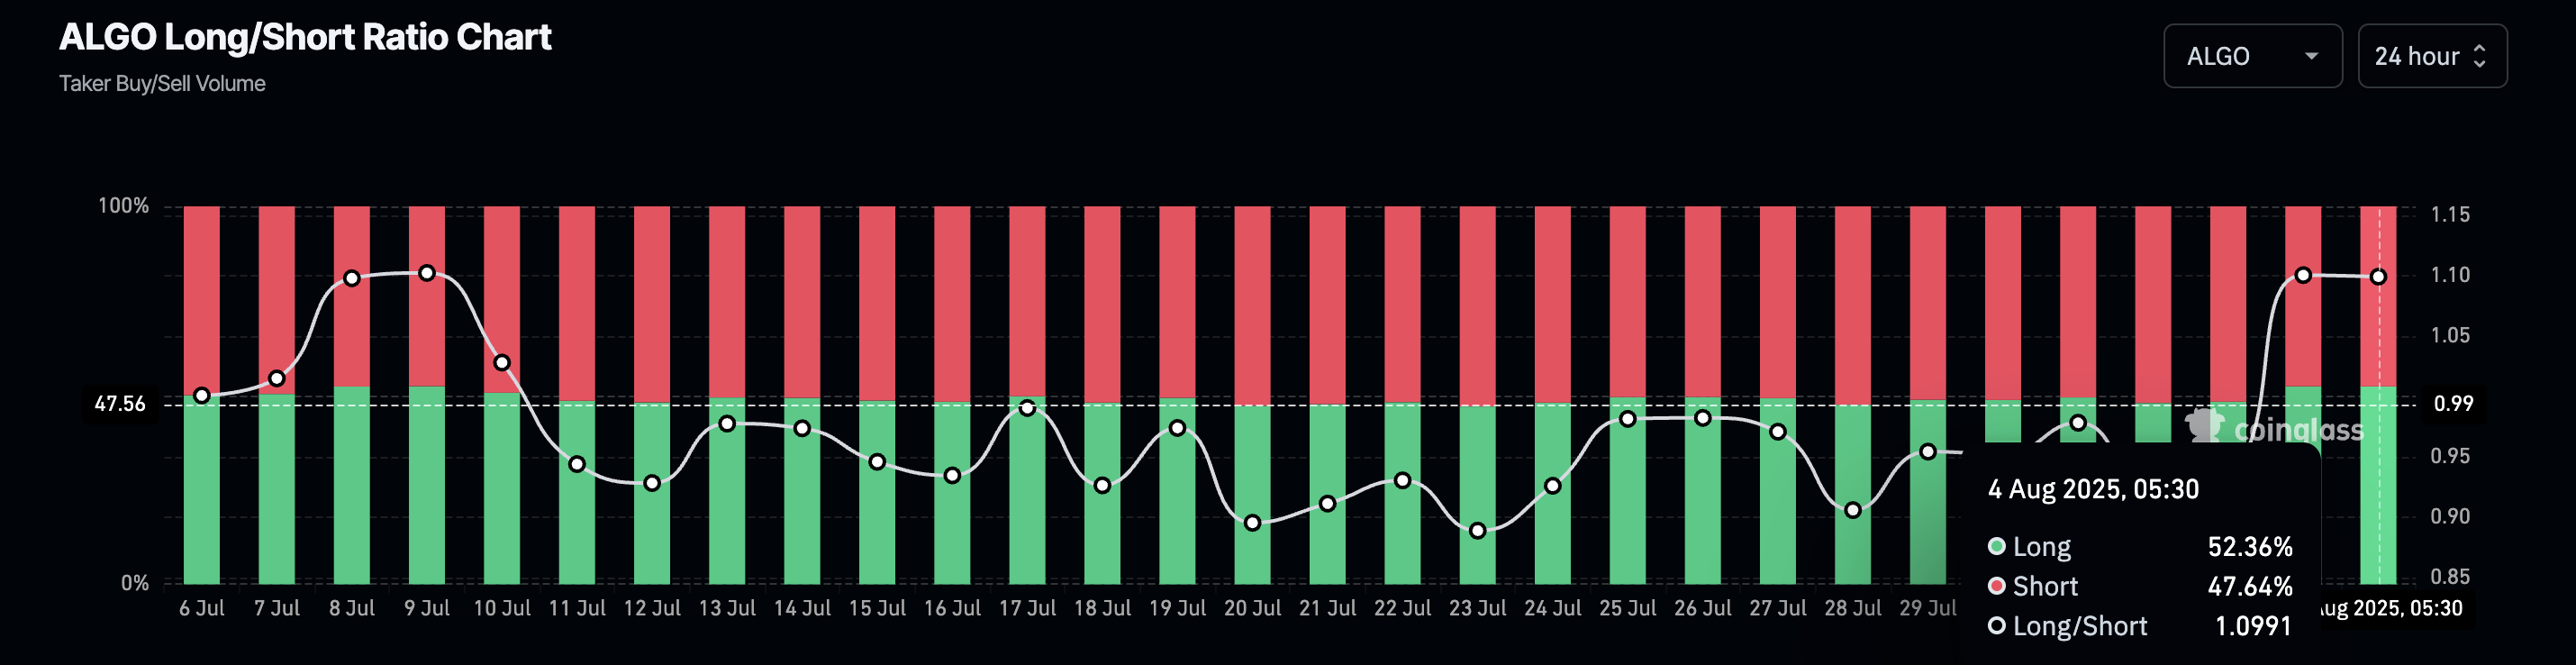
ALGO long/short ratio chart. Source: Coinglass
Still, capital inflows in ALGO futures and options contracts struggle, as Open Interest (OI) remains broadly steady at $119.01 million from $112.84 million on Sunday. Despite the nearly $7 million rise in the last 24 hours, ALGO OI is down by over $66 million from its peak of $185.83 million on July 18.
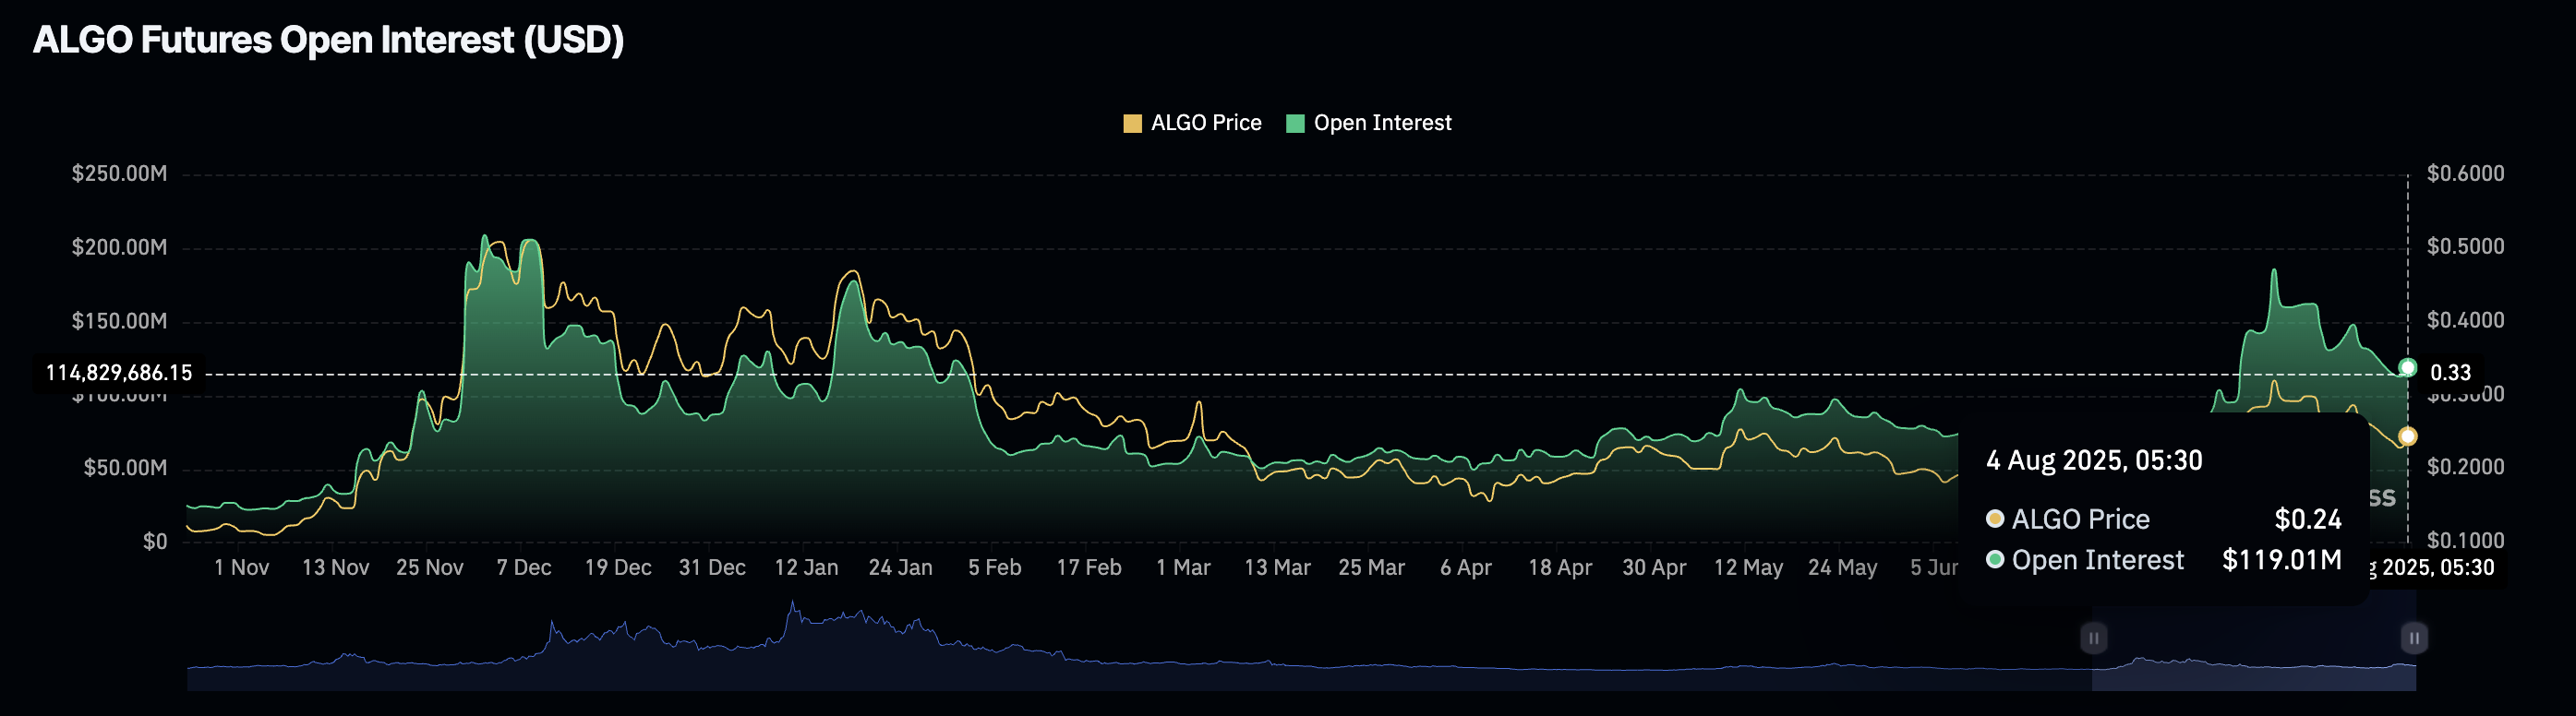
ALGO Open Interest. Source: Coinglass
Sidelined investors could consider a potential surge in OI as increased buying pressure if the long-to-short ratio holds over 1.
Algorand nears wedge breakout, targeting $0.28
Algorand bounces off a support trendline of a falling wedge pattern on the 4-hour chart (shared below). The recovery is underpinned by increased buying pressure as the Relative Strength Index (RSI) reaches 53 on the same chart, crossing above the halfway line. Investors could increase their exposure as the RSI shows space for growth before reaching overbought conditions.
Adding credence to increased bullish momentum, the Moving Average Convergence Divergence (MACD) displays a rising wave of green histogram bars from the zero line.
Investors could consider a clean push above the Supertrend indicator line at $0.2500, aligning with the wedge pattern’s overhead trendline, as a breakout entry opportunity. In such a case, the 50% Fibonacci level at $0.2797, drawn from the $0.3360 on July 18 to the $0.2234 on Sunday, could act as the primary target. Reaching that target would represent a 13% increase from current price levels.
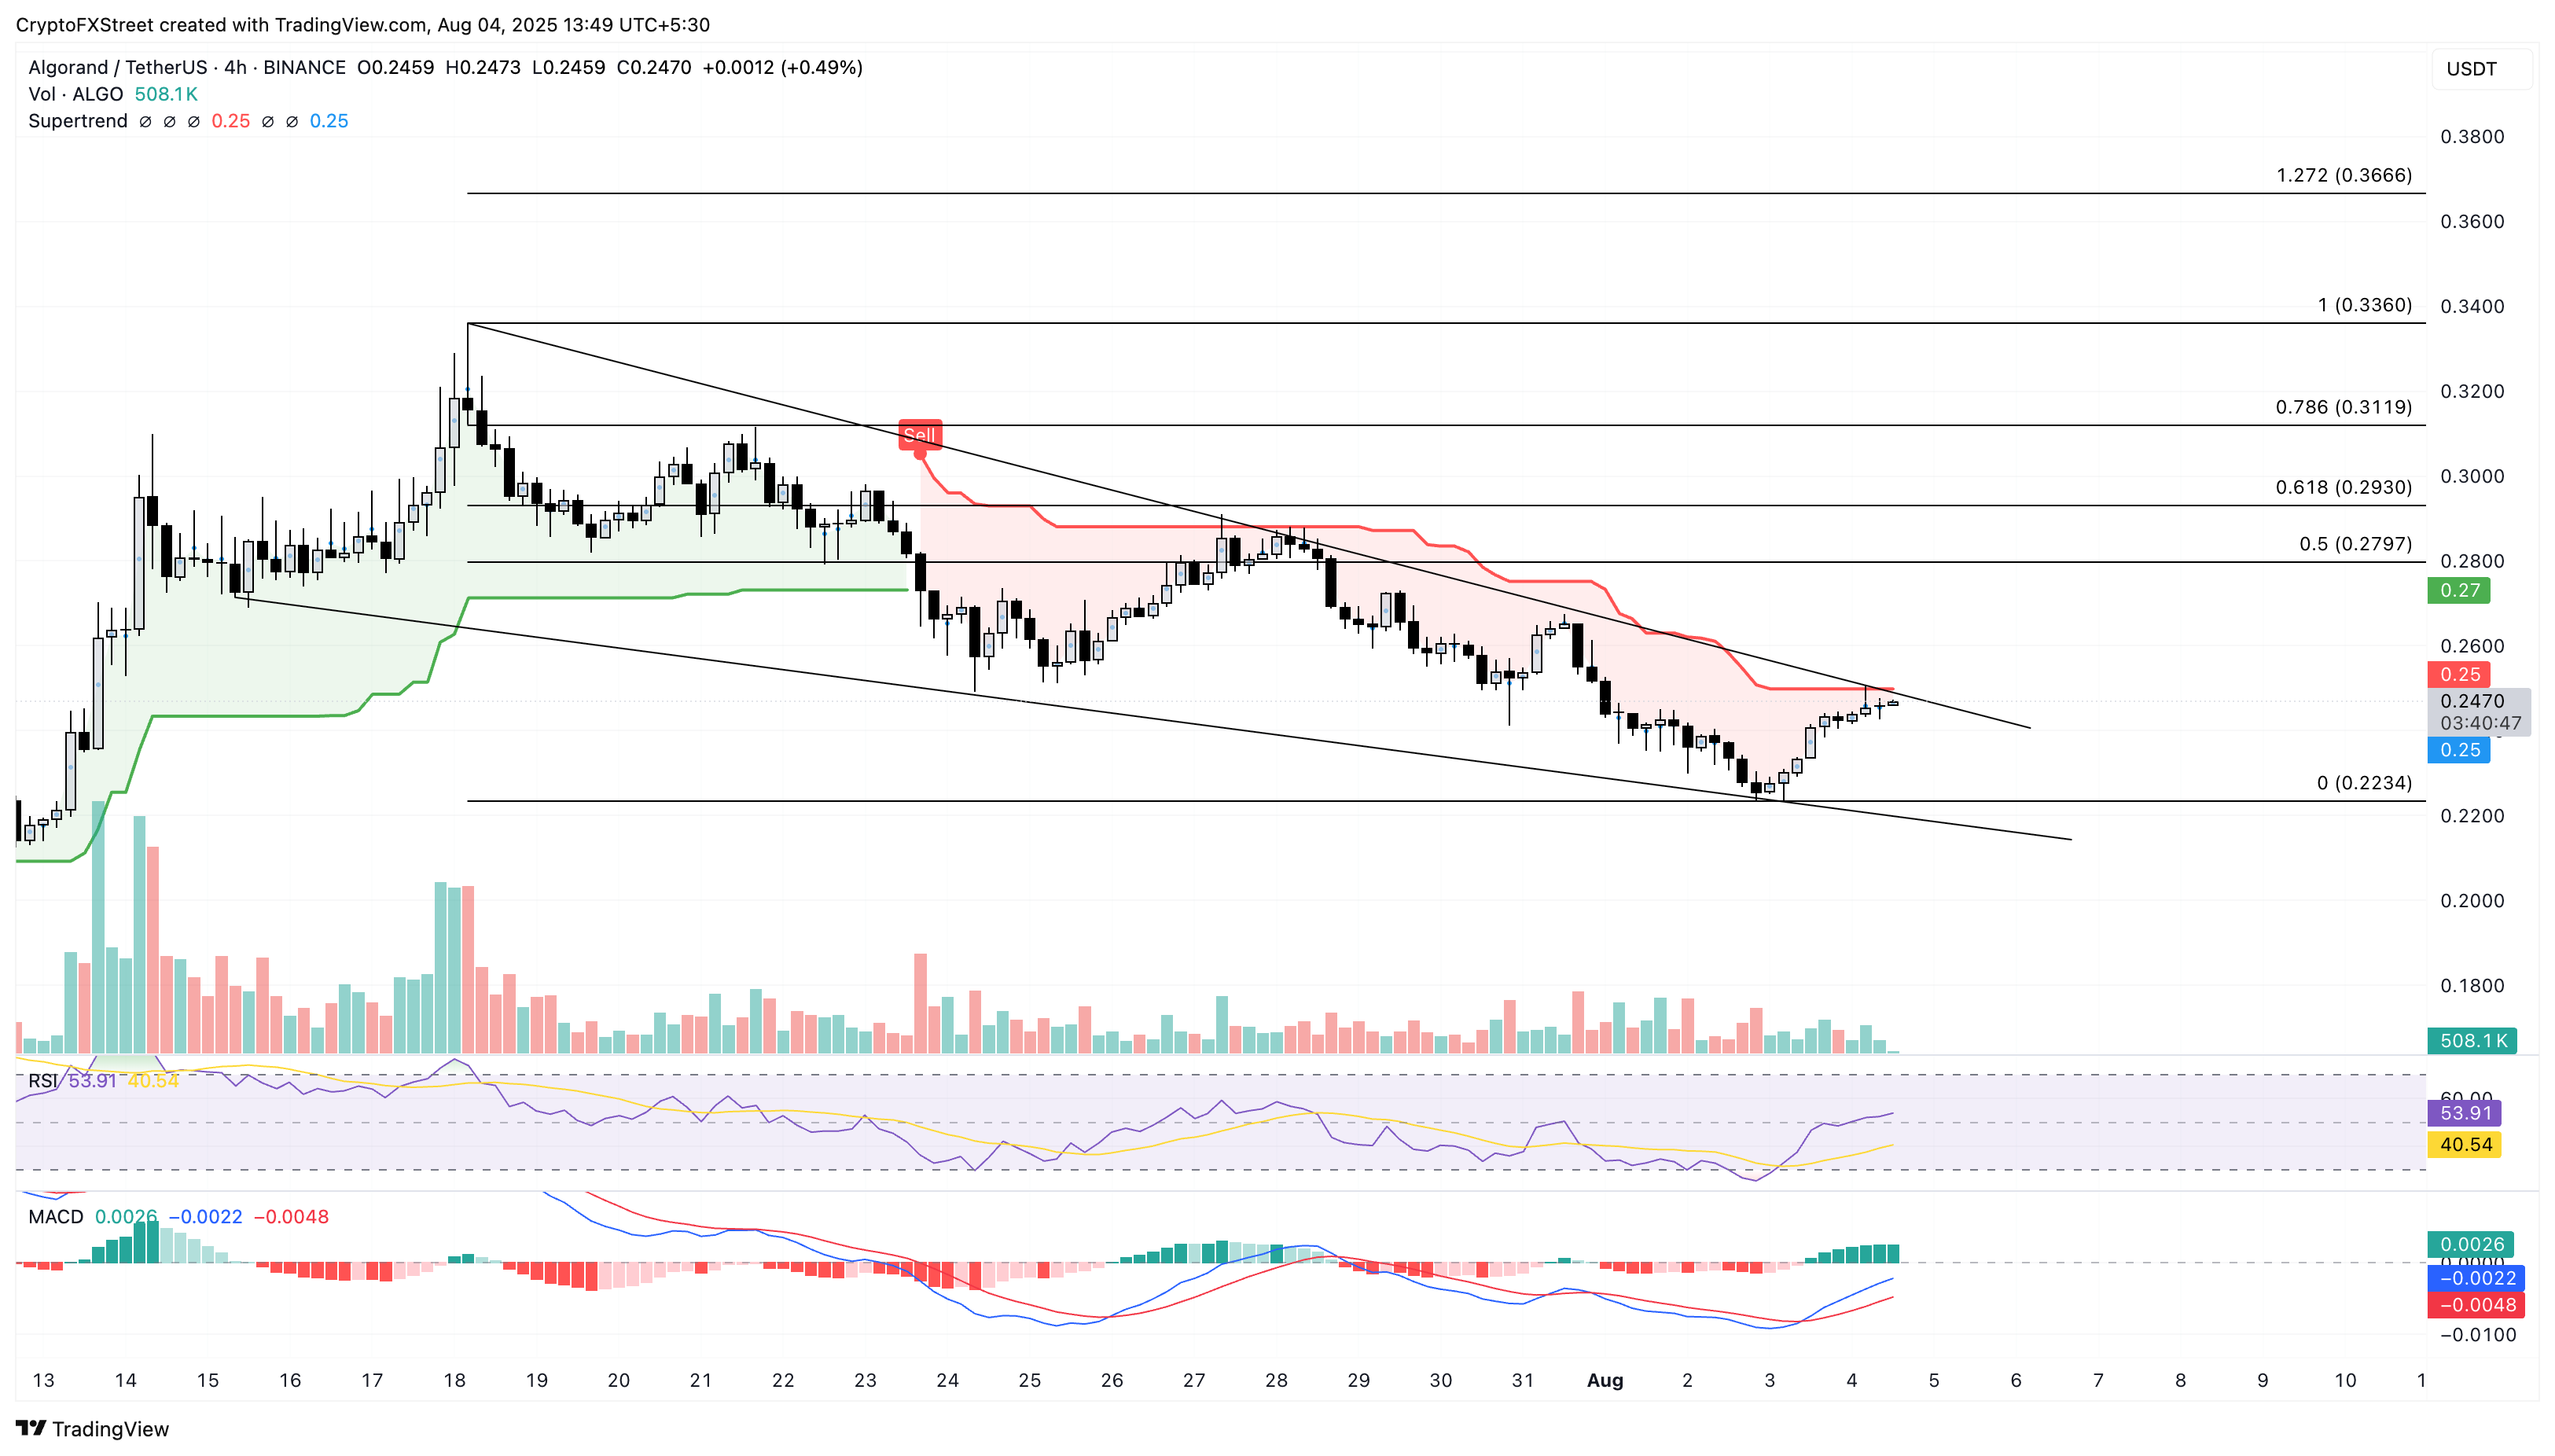
ALGO/USDT daily price chart.
On the downside, a reversal within the falling wedge pattern could retest the $0.2234 support floor.
Author

Vishal Dixit
FXStreet
Vishal Dixit holds a B.Sc. in Chemistry from Wilson College but found his true calling in the world of crypto.




