ADA price bullish breakout on the horizon as Cardano Foundation lands in Las Vegas
- Cardano price prepares for a falling wedge pattern breakout.
- The Cardano Foundation is in Las Vegas this weekend for the Web3 expo.
- Low trading volumes could invalidate ADA price's impending move to $0.47.

Cardano price appears stuck in a downtrend – between a higher low and lower low pattern. The smart contracts token recently rebounded from its support at $0.42. However, buyers have not been able to take over from bears, citing acute resistance at $0.44. On the bright side, the formation of a falling wedge pattern on the eight-hour chart hints at a potential bullish breakout.
Cardano Foundation in Las Vegas for the Web3 expo
The Cardano Foundation will grace the Web3 expo in Las Vegas on October 10 -13. The conference brings together all Web 3.0 and the metaverse at Wynn Resort & Casino. Investors and crypto enthusiasts will learn firsthand how to invest wisely in the dynamic Web 3.0 space from industry experts.
Before the conference on October 8 and 9, the Cardano Foundation will attend the cNFTcon event. The organization's head of partnerships and executive officer Jeremy Firster will lead the ecosystem.
Cardano price ready to climb 11% to $0.44
A falling wedge pattern forms after a big downward movement in price. Its upper trend line marks a sequence of higher lows, while the lower trend line joins a series of lower lows. As the two lines converge, ADA price consolidates.
A diminishing trading volume characterizes the mundane sideways movement at the pattern's apex. To validate the wedge, Cardano price must escape the pattern through the upper trend line before the lines meet.
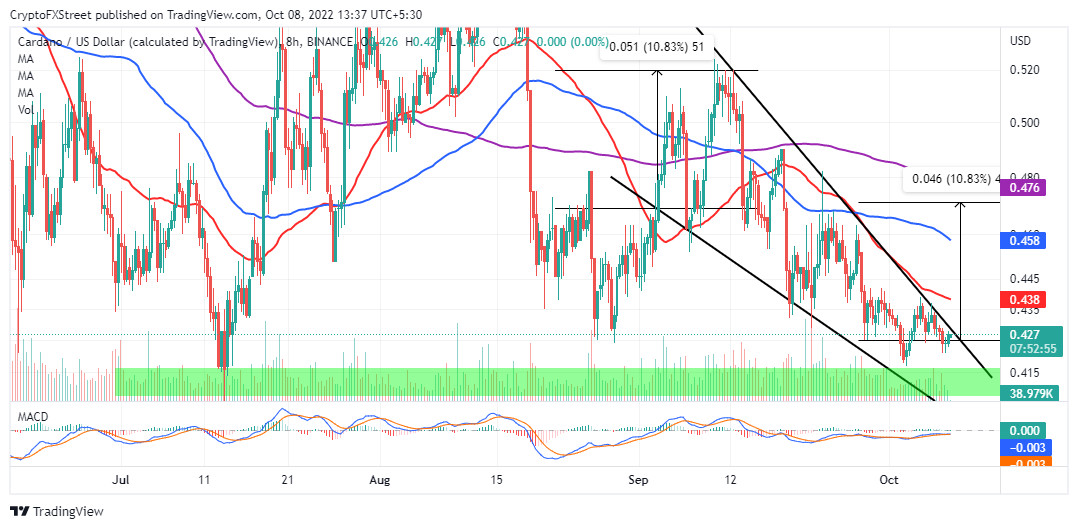
ADA/USD eight-hour chart
Traders should watch out for a sharp spike in volume as ADA price rises above the wedge pattern. Moreover, the MACD (Moving Average Convergence Divergence (MACD) will step into the positive region (above the mean line), further cementing the bulls' influence on the price.
A buy signal will come to life as the 12-day EMA (Exponential Moving Average), blue, crosses above the 26-day EMA, red. Although the wedge pattern suggests an 11% breakout to $0.47, traders could choose to take profit at the 50-day SMA and the 100-day SMA – keeping in mind the overall crypto bear market conditions.
Author

John Isige
FXStreet
John Isige is a seasoned cryptocurrency journalist and markets analyst committed to delivering high-quality, actionable insights tailored to traders, investors, and crypto enthusiasts. He enjoys deep dives into emerging Web3 tren



