AAVE topped DeFi growth in 2020 with a whopping 6,372% YoY, here is what to expect in 2021
- Aave has emerged as the top-performing asset among all DeFi projects in the cryptocurrency industry.
- AAVE/USD is struggling to find support above $130 following a rejection at $140.
- The IOMAP model reveals that AAVE has a smooth ride for gains above $140, likely to invalidate the bearish outlook.

The last few months of 2020 were extremely yielding. Bitcoin almost hit a record high at $42,000 while the rest of the cryptocurrencies grew significantly. Aave soared by a colossal 6,372%, topping decentralized finance digital assets (DeFi) year-over-year.
Aave outperforms other DeFi projects
According to Messari, a renowned cryptocurrency analysis platform, Aave almost tripled Yearn.Finance growth in 2020, which came second after soaring 2,729%. THORChain came third following a 1,700% spike ahead of UMA with 906%. Other great performers in the DeFi sector include Loopring at 690%, Gnosis at 575% and the token with the largest market cap in the ecosystem, Synthetix at 499%.
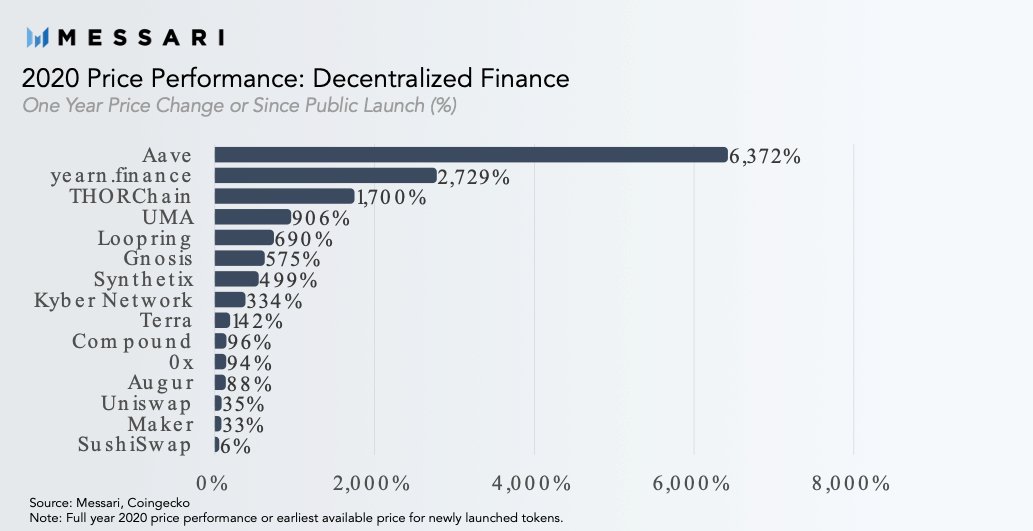
DeFi top performers in 2020
In the meantime, Aave is trading at $137 after hitting a barrier at $140. The goal among the bulls is to establish higher support, preferably above $130. If push comes to shove and losses stretch out significantly, AAVE price would test the 50 Simple Moving Average for support around $120.
-637461232658069064.png)
AAVE/USD 4-hour chart
The TD Sequential indicator has just presented a sell signal on the 4-hour chart, adding credence to the pessimistic outlook. The bearish formation developed as a green-nine candlestick anticipating a one to four daily candlesticks correction.
A red two candlestick trading below a preceding red-one candle could serve as confirmation that AAVE is poised to drop further.
-637461232623537363.png)
AAVE/USD 4-hour chart
On the other hand, IntoTheBlock’s IOMAP reveals the lack of a substantial resistance ahead of Aave. This shows that the DeFi token could rally to new yearly highs beyond $140 if the tailwind behind it surges.
-637461231349379065.png)
AAVE IOMAP chart
On the downside, Aave is sitting on areas with immense support. The most robust anchor zone runs from $117 to $121. Here, 1,600 addresses are currently profiting from the approximately 592,000 AAVE previously bought. It will be a daunting task for the bears to slice through this support area, which may invalidate the pessimistic outlook.
Author

John Isige
FXStreet
John Isige is a seasoned cryptocurrency journalist and markets analyst committed to delivering high-quality, actionable insights tailored to traders, investors, and crypto enthusiasts. He enjoys deep dives into emerging Web3 tren



![Zcash breaks above 2018 highs, eyes 1600–2500 [Video]](https://editorial.fxsstatic.com/images/i/crypto-coins-1.png)