|

Aave price is just a few dollars away from $100, while technicals spell trouble

  • Aave price seems to be contained inside an ascending wedge on the 4-hour chart.
  • The digital asset is close to hitting $100 but some indicators show it might be poised for a pullback first.

Aave has been inside a robust uptrend since its token swap from LEND to AAVE on October 20. The digital asset is now on the verge of hitting $100 for the first time since its swap but there is one indicator that suggests it could be on the verge of a correction.

Aave price is on the cusp of a breakout or breakdown

On the 4-hour chart, Aave has established an ascending wedge that is on the verge of a breakout or breakdown. The current Aave price of $91 is right in the middle of the pattern which doesn’t favor either side.

aave price

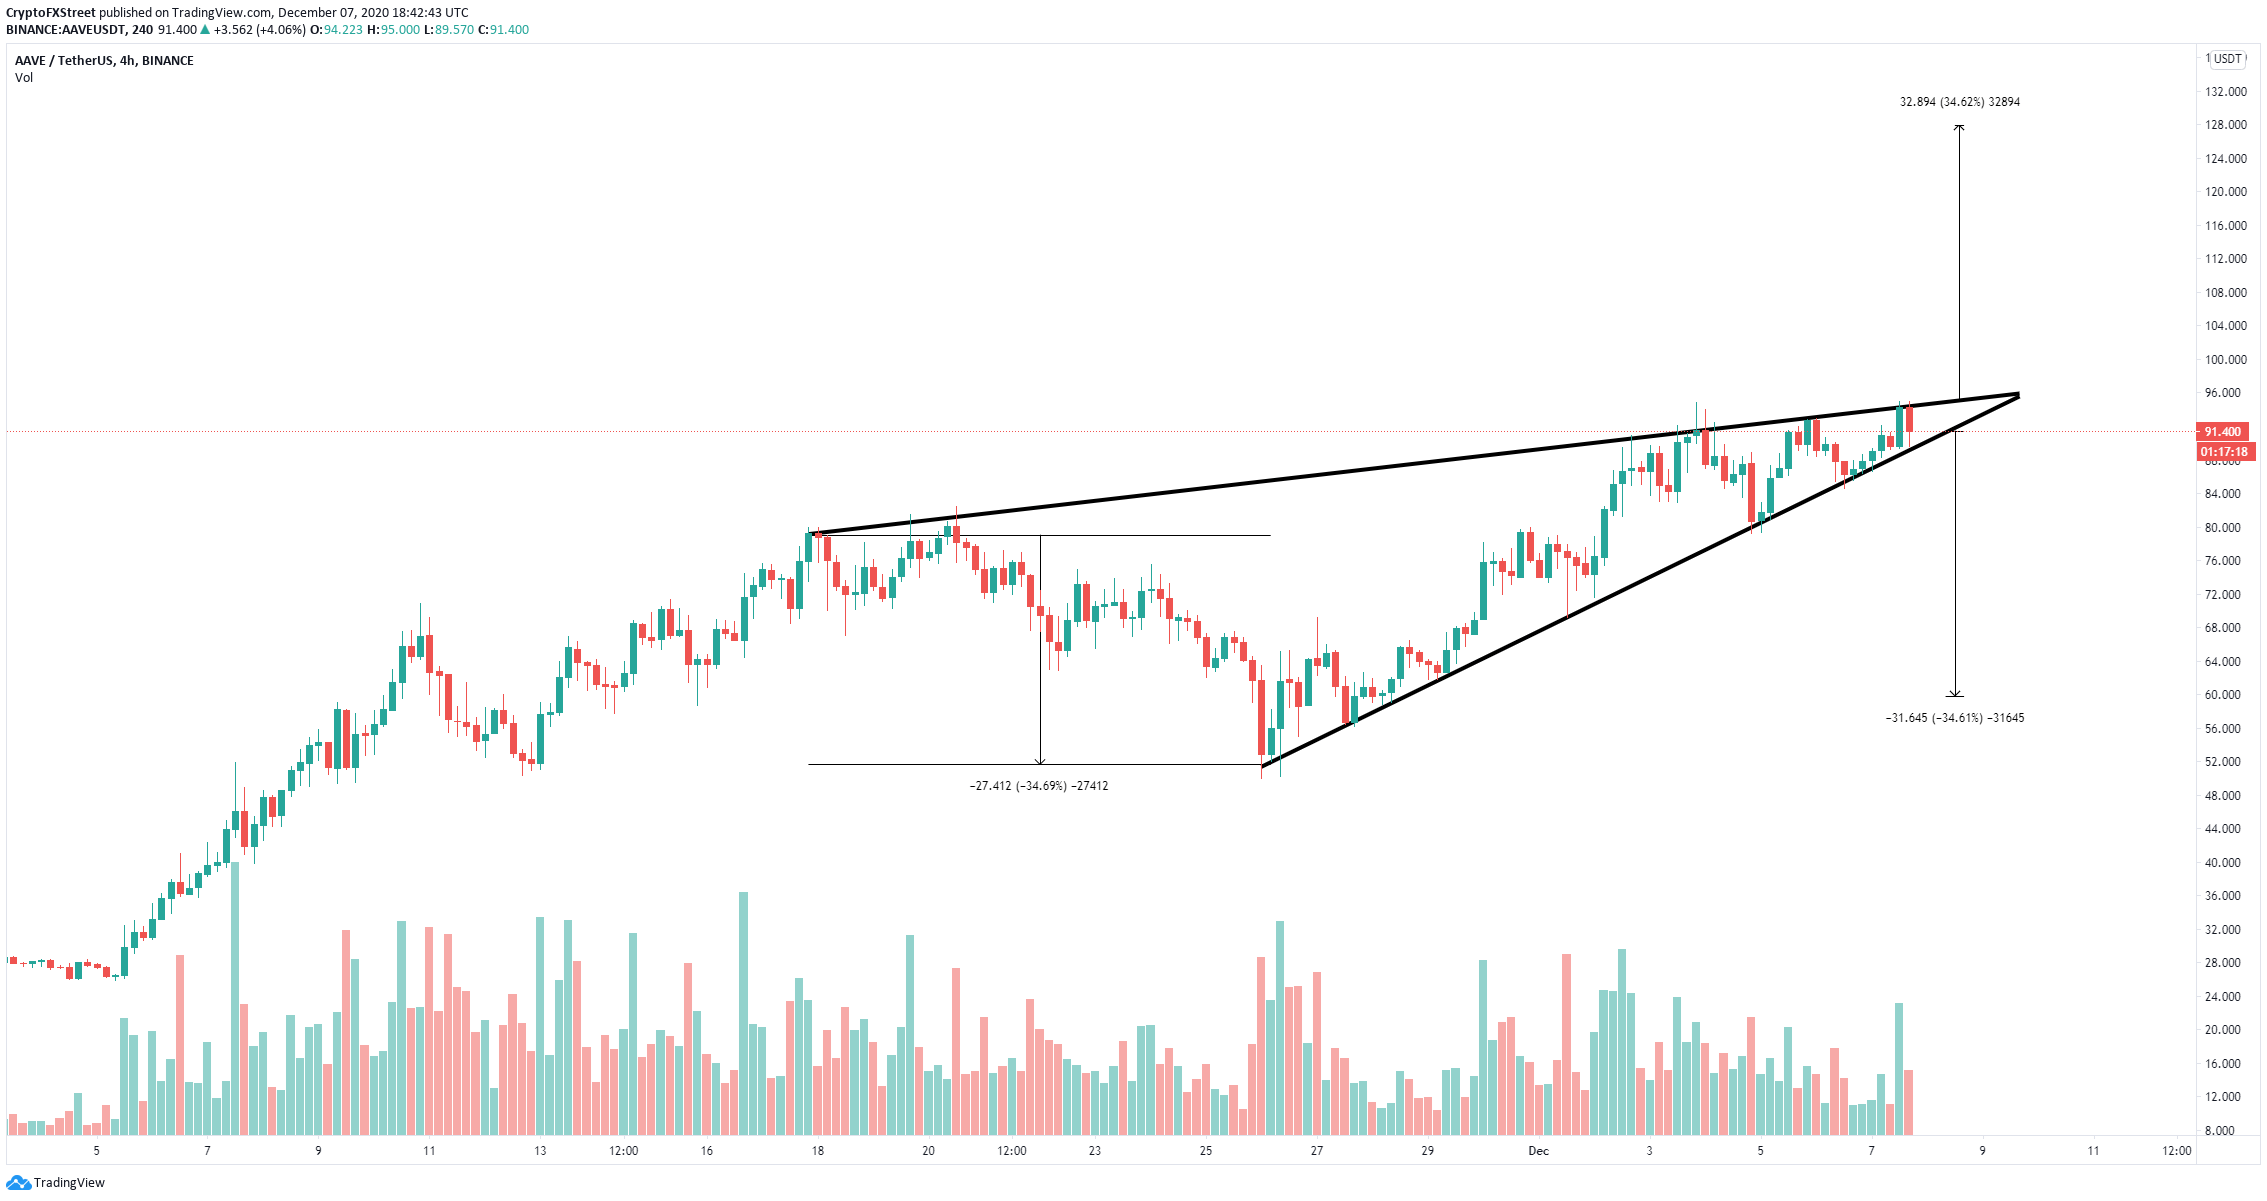
AAVE/USD 4-hour chart

Unfortunately, it seems that the TD Sequential indicator has presented a sell signal on the daily chart for the first time since the swap. A breakdown below the lower trendline of the ascending wedge at $90 would quickly drive Aave price towards $60.

aave price

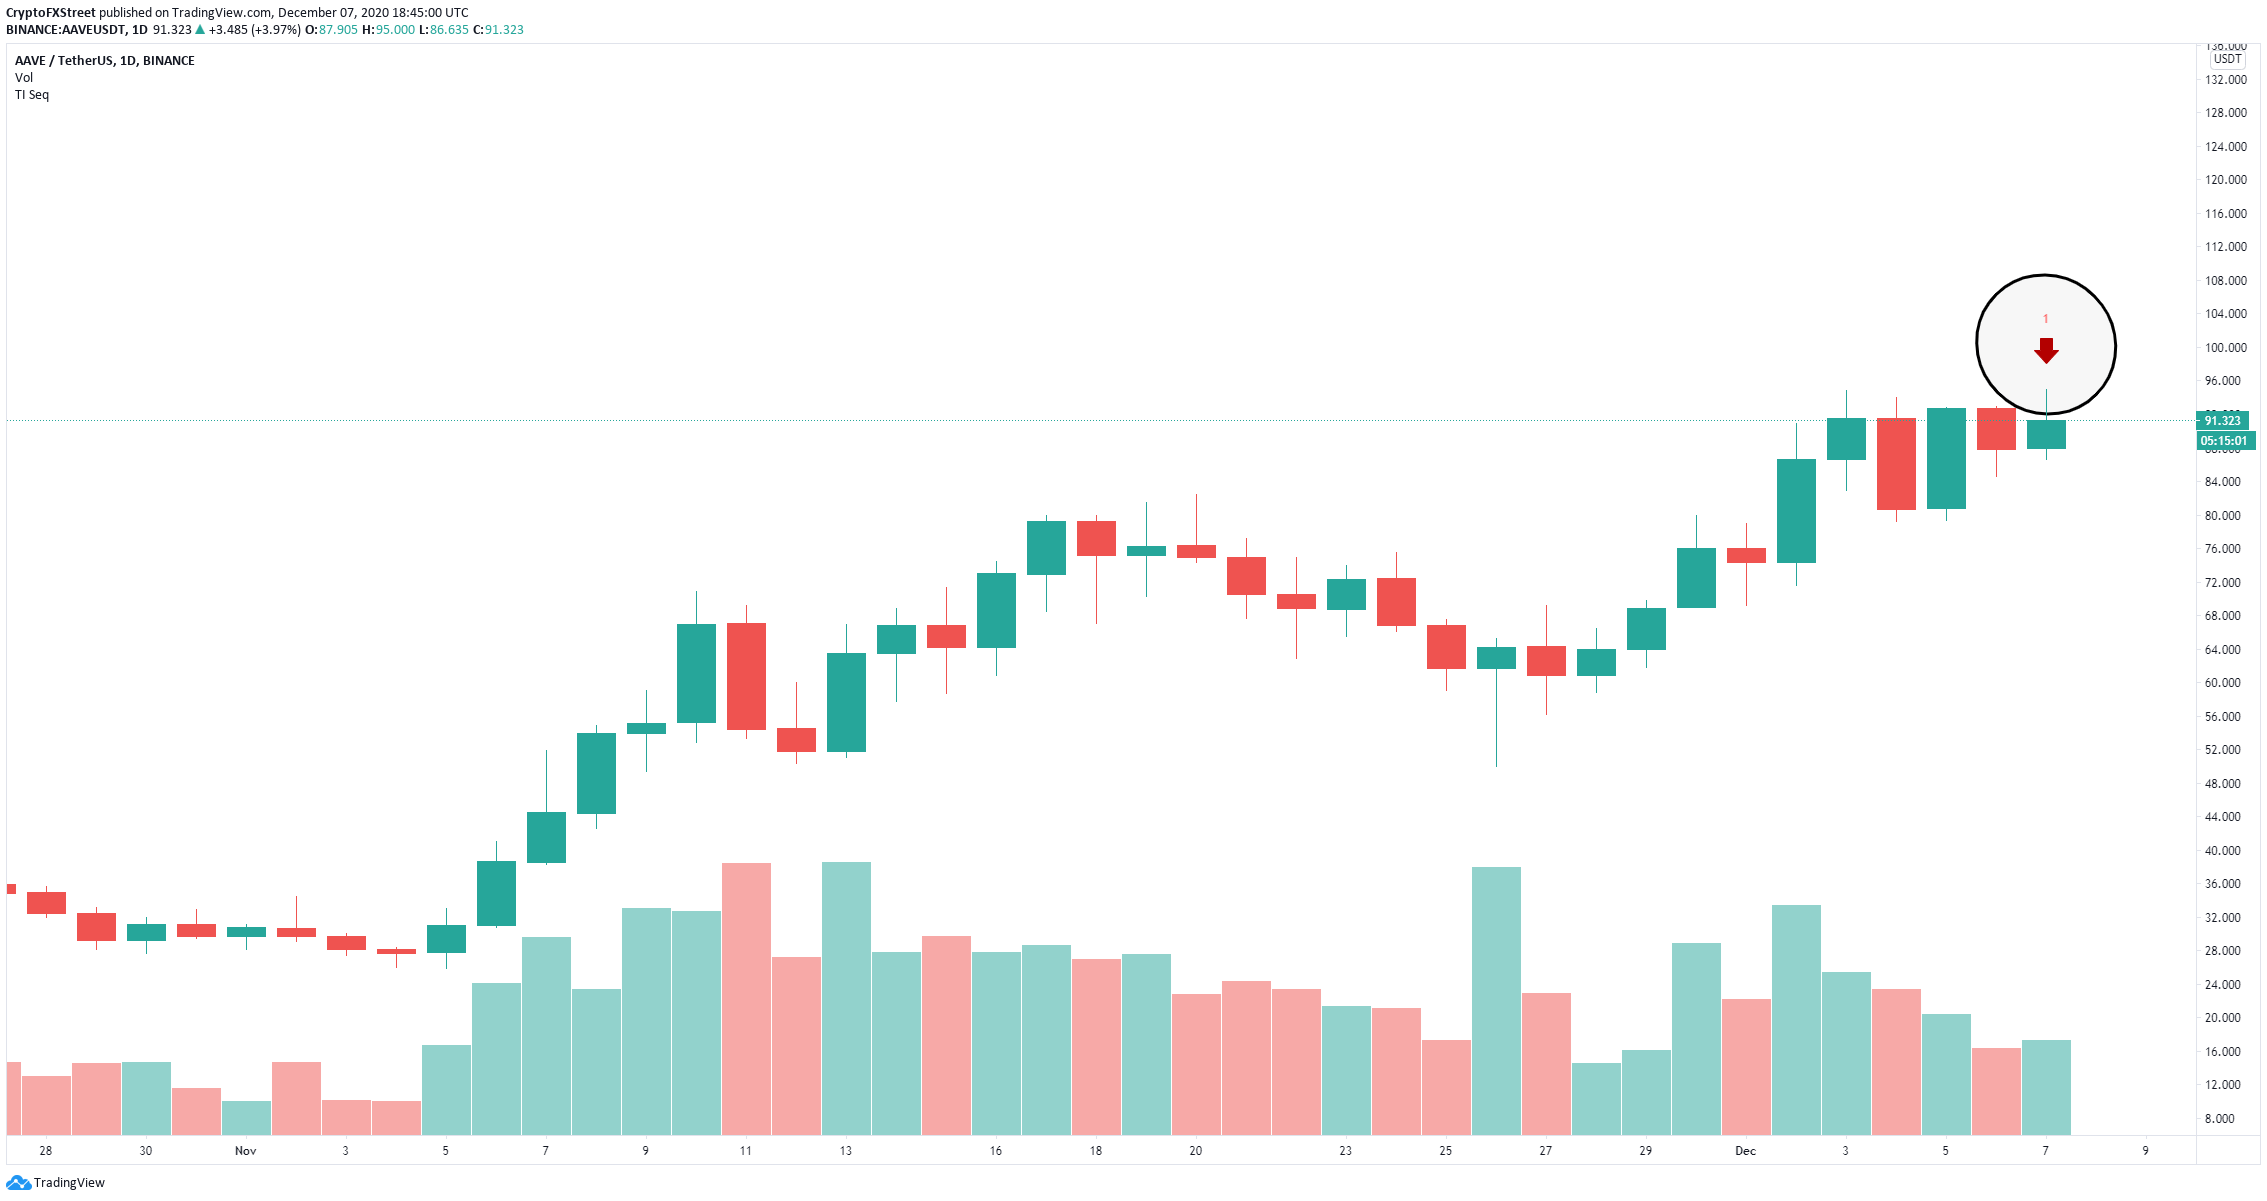
AAVE/USD daily chart

On the other hand, a breakout above the upper boundary of the pattern can push Aave price towards and above $100 and potentially to a high of $130 as a long-term price target for the bulls.

aave price

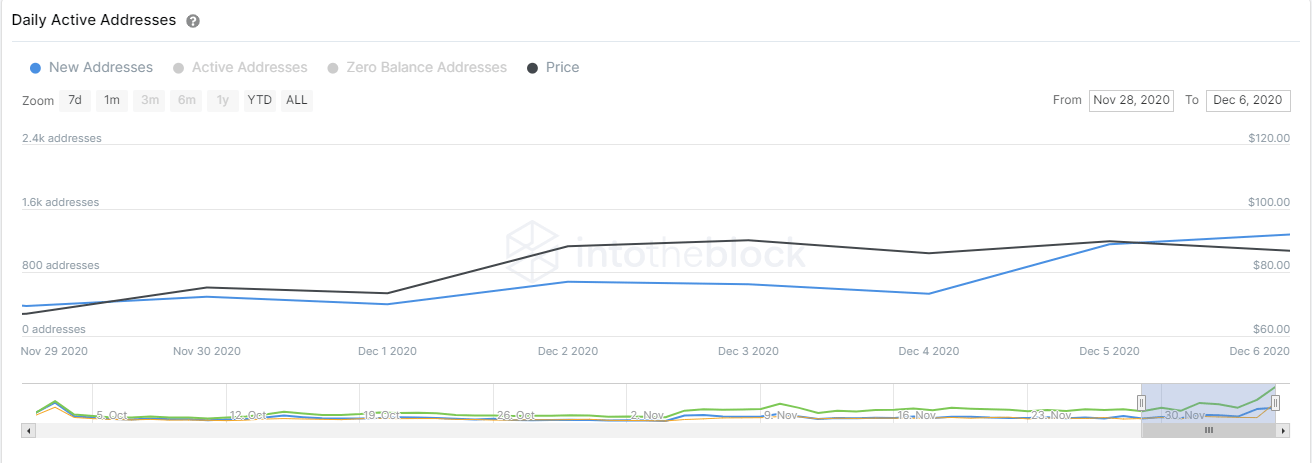
AAVE new addresses chart

The chart of new addresses joining the network shows a massive influx in this number in the past week, jumping by 237%. This metric shows that new investors are extremely interested in the digital asset which translates into buying pressure.

Author

Lorenzo Stroe

Lorenzo Stroe

Independent Analyst

Lorenzo is an experienced Technical Analyst and Content Writer who has been working in the cryptocurrency industry since 2012. He also has a passion for trading.

More from Lorenzo Stroe
Share:

Editor's Picks

Sui extends sideways action ahead of Grayscale’s GSUI ETF launch

Sui is extending its downtrend for the second consecutive day, trading at 0.95 at the time of writing on Wednesday. The Layer-1 token is down over 16% in February and approximately 34% from the start of the year, aligning with the overall bearish sentiment across the crypto market.

XRP pares losses, targets breakout above $1.50 as ETF demand diminishes

XRP pares losses as bulls target a short-term breakout above $1.50. The MACD upholds a buy signal while the MFI indicator rises above the midline, suggesting a potential bullish shift.

Ghost holding in BlackRock’s IBIT sparks Chinese Bitcoin investment whispers

A new entity identified in BlackRock's quarterly filing for its Bitcoin (BTC) Exchange-Traded Fund (ETF) IBIT has sparked rumors of Chinese investment under the name of Zhang Hui, despite the nationwide ban on the Crypto King. 

Crypto Today: Bitcoin, Ethereum, XRP rebound slightly as technicals signal bullish shift

The cryptocurrency market is showing signs of a gradual recovery, with Bitcoin (BTC), Ethereum (ETH), and Ripple (XRP) all edging higher at the time of writing on Wednesday after the price declines seen a day earlier. 

Bitcoin Price Annual Forecast: BTC holds long-term bullish structure heading into 2026

Bitcoin (BTC) is wrapping up 2025 as one of its most eventful years, defined by unprecedented institutional participation, major regulatory developments, and extreme price volatility.

Bitcoin: BTC bears aren’t done yet

Bitcoin (BTC) price slips below $67,000 at the time of writing on Friday, remaining under pressure and extending losses of nearly 5% so far this week.