WTI oil futures gently move up, AUD/USD spikes after soft US CPI print

WTI oil futures gently move up, key resistance ahead
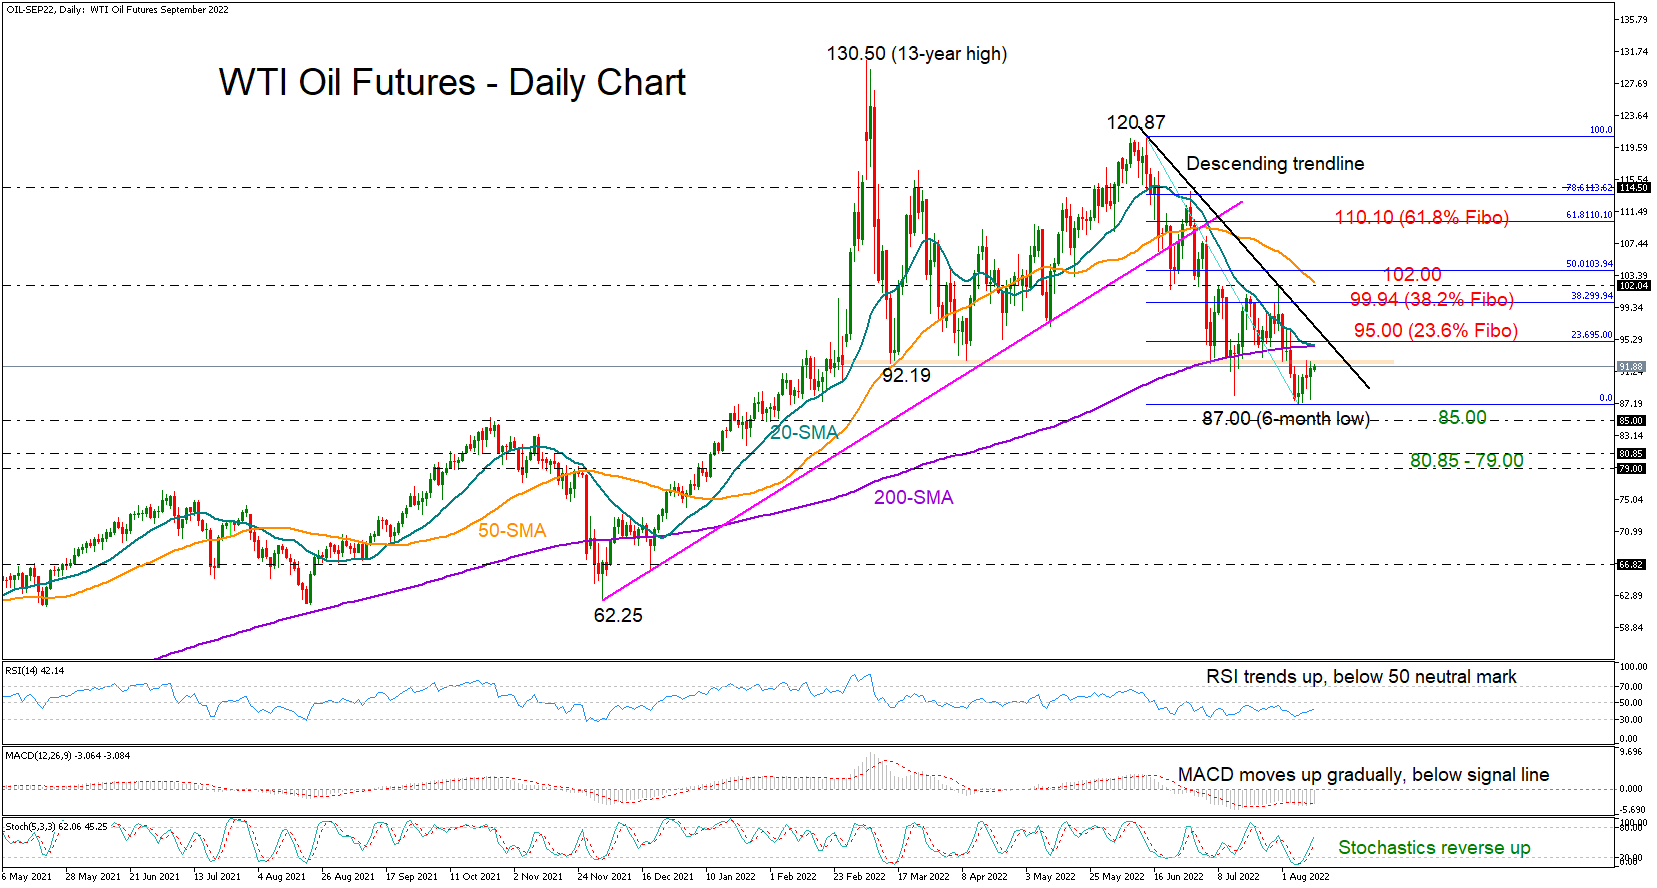
WTI oil futures (August delivery) have been gently crawling up over the past week following the close below the 200-day simple moving average (SMA) and the drop to a six-month low of $87.00/barrel.
The price is currently looking to return above the $92.19 constraining zone, which was the lower boundary of the previous range area, but this will not be enough to boost buying confidence. The bulls will also need to climb above the 20- and 200-day SMAs, which are trying to set a bearish cross near the 23.6% Fibonacci retracement of the latest downtrend around $95.00. The descending trendline drawn from the $120.87 peak could further cement that wall, blocking the way towards the 38.2% Fibonacci of $99.94 and the $102.00 barrier, where the 50-day SMA is currently residing.
The positive momentum in the RSI and the MACD, as well as the upside reversal in the stochastics is reflecting some improvement in market sentiment, though as long as the two former remain in the bearish area, downside corrections are possible. In this case, the price could diminish back to the $87.00 low if the $92.19 zone rejects any additional bullish movements. Lower, the bears will aim to downgrade the long-term outlook back to neutral below $85.00. If they succeed, the sell-off could pick up steam towards the $80.85 – $79.00 region.
In brief, WTI oil futures may attempt to extend their recovery in the coming sessions, though only a decisive close above $95.00 could attract fresh buying interest.
AUD/USD spikes after soft US CPI print
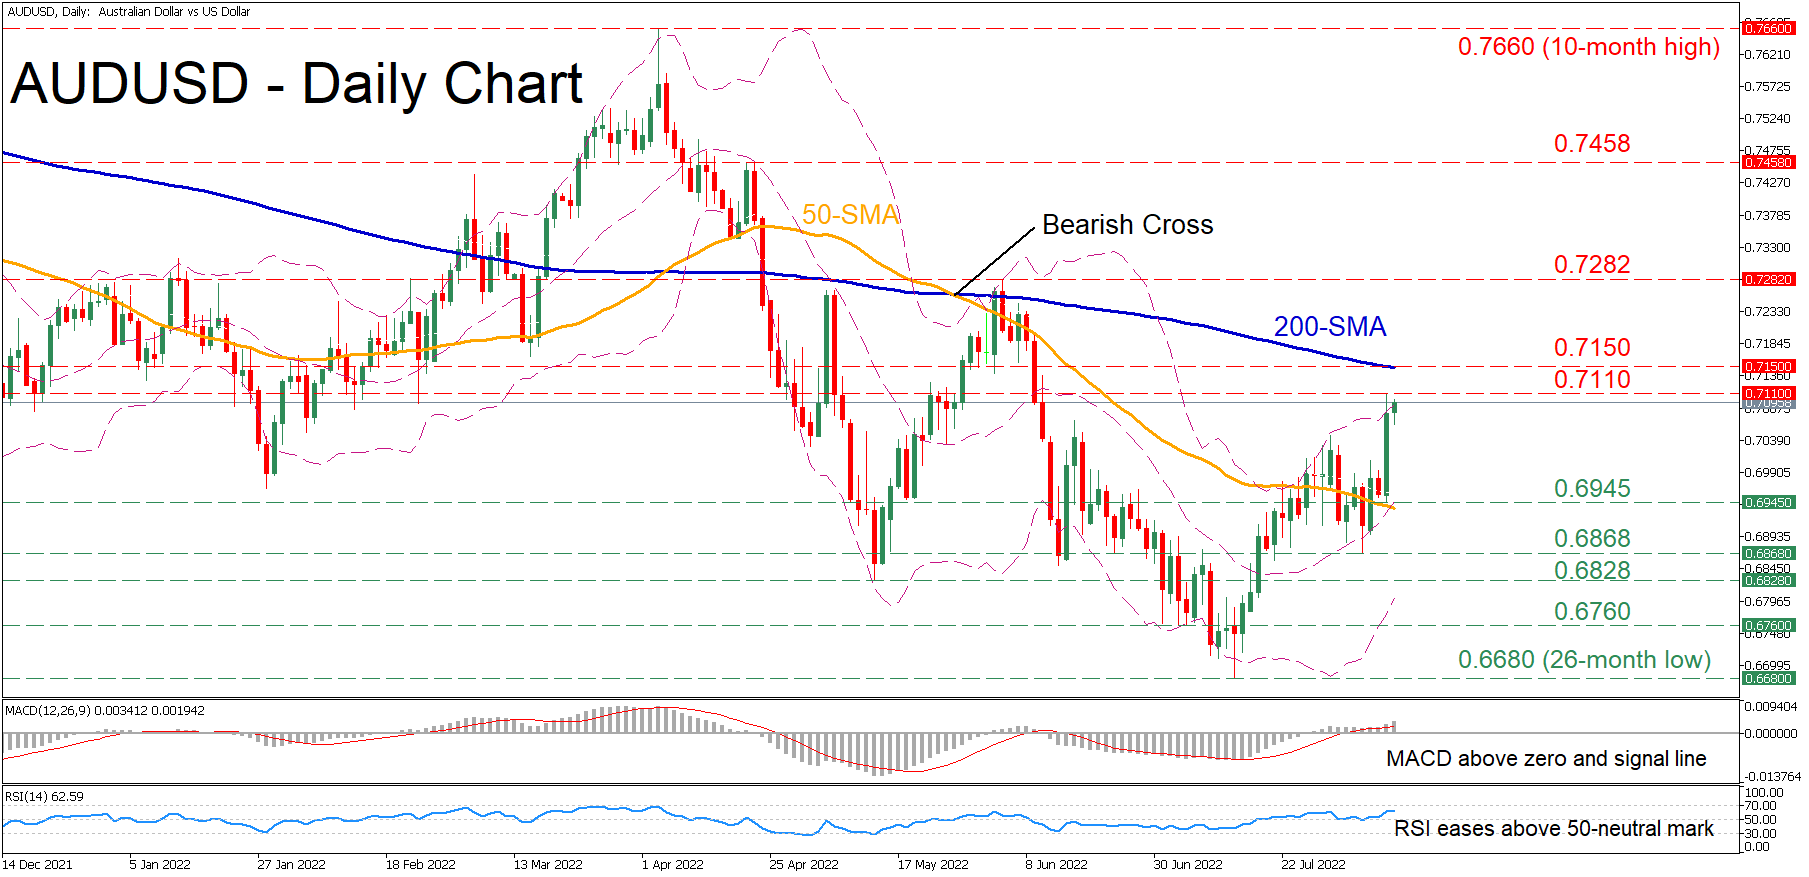
AUDUSD had been battling with its 50-day simple moving average (SMA) after it rebounded from the 26-month low of 0.6680. However, in the previous session the pair experienced a huge jump, closing decisively above its 50-day SMA and coming to a halt at the upper Bollinger band.
The short-term oscillators are reflecting the intensifying positive momentum. Specifically, the MACD histogram has jumped above zero and its red signal line, while the RSI is flatlining above its 50-neutral threshold.
Should buying pressures persist, the recent peak of 0.7110 could be the initial resistance barrier. Piercing through this region, the bulls could target the 200-day SMA, currently at 0.7150. Violating this zone, the spotlight might turn to the June high of 0.7282 before 0.7458 appears on the radar.
On the flipside, if the pair reverses downwards, the 0.6946 hurdle may act as the first line of defence. Should that floor collapse, the recent low of 0.6868 might come under examination. Failing to halt there, the price could descend towards the May low of 0.6828 or lower to challenge the 0.6760 region.
Overall, AUDUSD is showing an appetite for some recovery. Therefore, a break above 0.7282 is needed to alter its medium-term outlook to bullish.
Author

Christina joined the XM investment research department in May 2017. She holds a master degree in Economics and Business from the Erasmus University Rotterdam with a specialization in International economics.


