Weekly technical market insight: The US dollar appears robust, according to a technical viewpoint

US dollar index (Daily Timeframe)
Successfully snapping a three-week bullish phase, sellers stepped in last week and pulled the US Dollar Index 0.5 per cent lower. As central bankers around the world attempt to curb escalating inflation—increasing rates in chorus with the US Federal Reserve—the greenback may struggle against its major peers.
Through the lens of a market technician, however, the US dollar is healthy, recently fading near-two-decade tops at 105.79 as well as shaving the upper limit of a decision point at 105.61-104.87. Given this, and the current trend (I talk about this shortly), is the buck looking at a dip-buying scenario over the coming weeks? And if so, do the charts deliver appropriate support? The 50-day simple moving average at 103.04 is an obvious dynamic support this week, sharing chart space nearby an ‘acceleration’ trendline support, taken from the low 95.17. Upstream, assuming the unit eventually dethrones the current decision point, brings light to Quasimodo resistance from 106.97.
Trend studies remain unchanged and supports additional buying. Direction has exhibited well-defined upward movement since price made contact with support from 89.69 in May 2021. The upside bias is also shown through the 50-day simple moving average crossing above the 200-day simple moving average (trading at 97.85) in August 2021 (‘Golden Cross’). Accompanying this upside bias, you will see on the weekly timeframe we have actually been higher (overall) since early 2008.
Through the relative strength index (RSI), recent momentum studies reveal negative divergence established just south of indicator resistance from 79.23, a sign of slowing momentum and somewhat harmonising with the notion that dollar bidding is to slow. Should the indicator extend its retracement this week, focus swings to support between 40.00-50.00: a ‘temporary’ oversold region serving the indicator well since August 2021 (common viewing in strongly trending environments). Traders/investors who adopt technical reasoning, in the case of a test of this area, will likely be watching for a bottoming scenario to play out.
Technical expectation
Despite the RSI demonstrating a divergence signal, the US dollar appears robust, according to a technical viewpoint. This—coupled with the primary bull trend—dip-buyers could make an entrance from within the area between the 50-day simple moving average and the ‘acceleration’ trendline support, targeting Quasimodo resistance from 106.97.
-637918217760879043.jpg)
EUR/USD
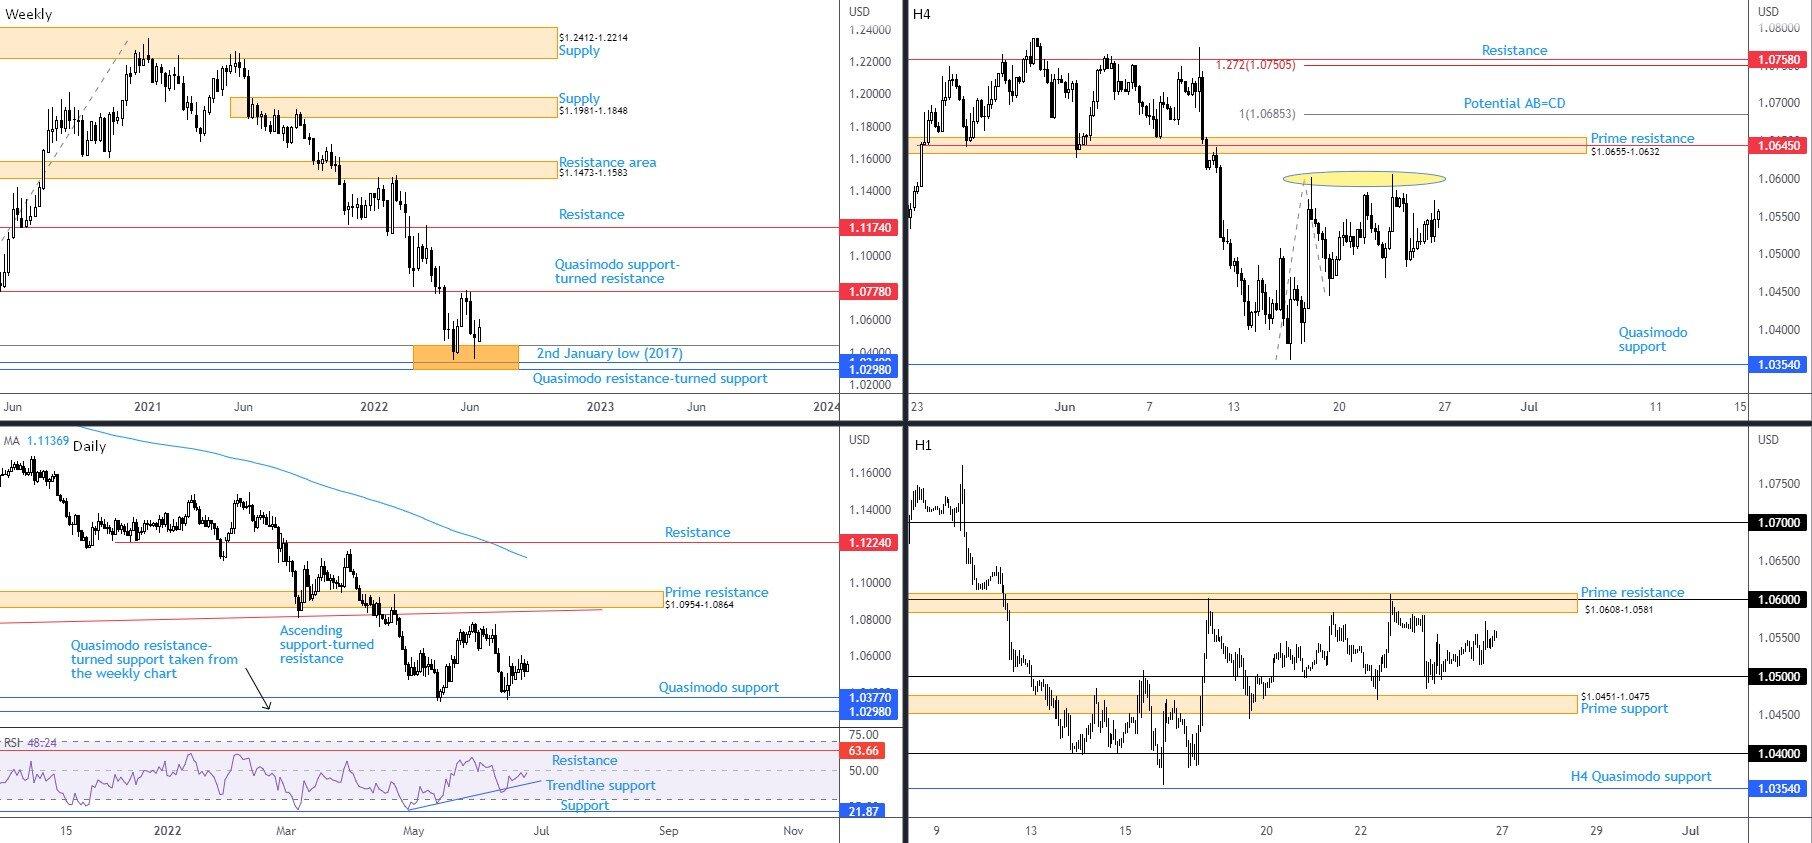
Against the US dollar, Europe’s single currency booked a modest gain of 0.6 per cent on the week, following the prior week’s long-legged doji candle. Whether this, and current weekly support (I talk about this shortly), is sufficient to motivate buyers this week is difficult to estimate. This is because the general trend in this market reflects a primary bear trend, establishing a series of lower lows and lower highs since 2021. Adding to this, seen from the weekly timeframe, the vibe has been to the downside since topping in April 2008. The trend, therefore, is likely one of the main factors discouraging any meaningful buying from current weekly support, made up between Quasimodo resistance-turned support at $1.0298, 2nd January low at $1.0340 (2017), and a 100% Fibonacci projection at $1.0445 (AB=CD harmonic bullish formation). Should weekly flow remain beneath Quasimodo support-turned resistance from $1.0778, and eventually disassemble current support (as the trend suggests), a 1.272% Fibonacci projection may be targeted beneath parity at $0.9925.
Fusing with current weekly support is Quasimodo support on the daily timeframe from $1.0377, a base welcoming buyers in May and in mid-June. Shoring up current support is also the relative strength index (RSI) rebounding from trendline support, taken from the low 23.08. If the momentum gauge grips higher levels and ruptures the 50.00 centreline, this would be regarded as a positive sign for bulls (average gains exceeding average losses). Interestingly, upstream on the daily price chart singles out prime resistance at $1.0954-1.0864 and an ascending support-turned resistance, drawn from the low $1.0340. Note that the daily zones are located north of the weekly resistance mentioned above at $1.0778.
Prime resistance on the H4 timeframe at $1.0655-1.0632 is an area I’ve been observing since higher timeframe price action rebounded from weekly support. In fact, the recent topping around $1.0603 (yellow zone) has further emphasised the aforementioned prime resistance. Above $1.0603 will likely contain buy-stops which might function as liquidity for $1.0655-1.0632 shorts to sell into. An additional observation on the H4 scale is the potential for an AB=CD bearish pattern (100% Fibonacci projection) to form just above current prime resistance at $1.0685. Lower on the curve, nevertheless, focus remains on Quasimodo support at $1.0354.
As evident from the H1 chart, buyers and sellers spent the week working in between prime resistance at $1.0608-1.0581 (houses $1.06) and prime support coming in at $1.0451-1.0475, pinned just beneath $1.05. My attention (early week) remains centred on $1.0608-1.0581. While a reversal from the H1 zone could unfold from the above-mentioned area, rupturing the resistance is on the table, with H4 prime resistance waiting to welcome price at $1.0655-1.0632.
Technical expectation
A run of stops above H1 prime resistance at $1.0608-1.0581 may draw a fakeout to H4 prime resistance nearby at $1.0655-1.0632 this week. You will likely acknowledge that the H1 prime resistance actually holds the tops mentioned on the H4 scale at $1.0603.
For the most part, a whipsaw of $1.0608-1.0581 on the H1 might be considered a bearish play, as sellers (in line with the overall trend) could enter from $1.0655-1.0632, attempting to fade buy-stop momentum above the H1 zone and $1.06.
However, traders are encouraged to also remain aware that the EUR/USD is currently bid from higher timeframe support, in spite of a decisive downtrend.
AUD/USD
It was a quiet week for AUD/USD, adding a paltry 0.1 per cent, following two back-to-back weeks of declines. As a result, the following analysis will echo thoughts derived from last week’s weekly technical briefing.
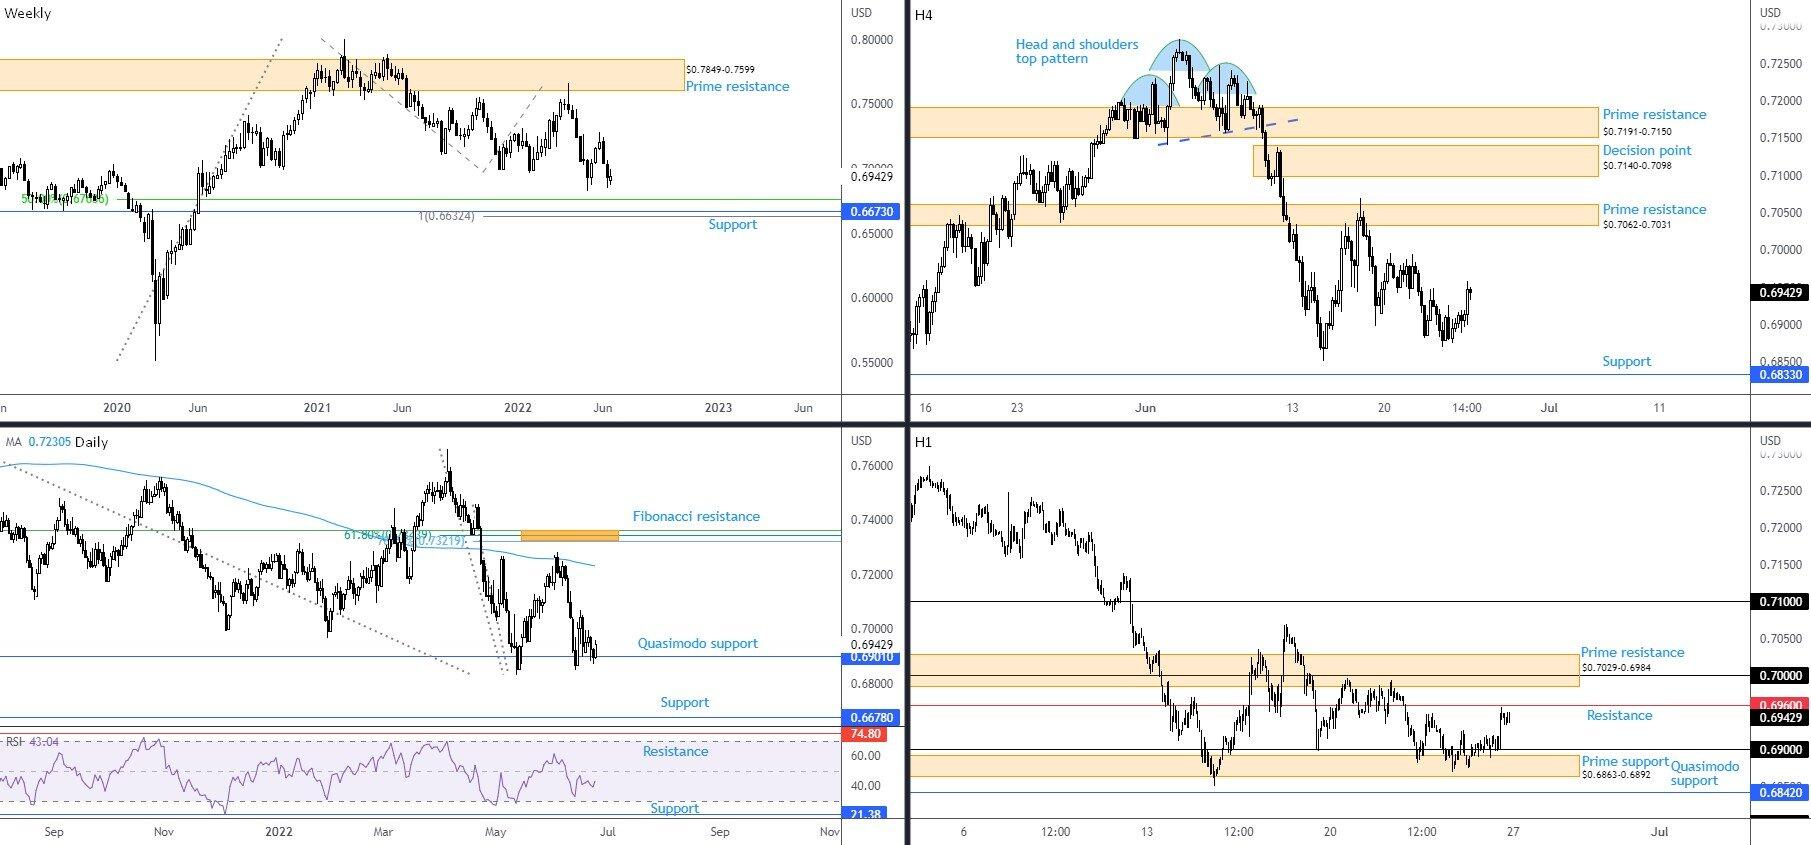
Focus remains on weekly support between $0.6632 and $0.6764 on the bigger picture, composed of a 100% Fibonacci projection, a price support, and a 50% retracement. Supporting the possibility of a push lower to the aforesaid support is the long-term trend direction. The monthly timeframe has portrayed a downtrend since August 2011, indicating the rally from the pandemic low of $0.5506 (March 2020) to a high of $0.8007 (February 2021) on the weekly timeframe is likely viewed as a deep pullback among long-term chartists. Downside from the 2021 February top (an early primary bear trend), therefore, is potentially seen as a move to explore lower over the coming weeks.
Out of the daily chart, the pair continues to work under the 200-day simple moving average at $0.7231 and is threatening to topple Quasimodo support at $0.6901. Clearing the aforesaid level sets the stage for an approach to support at $0.6678, a level nestled within current weekly support. According to the relative strength index (RSI), the indicator has registered minus 50.00 values since early June, informing traders that, on average, losses are exceeding gains: negative momentum. The question is whether we will see oversold space tested this week? Without price breaching $0.6901, I do not see oversold conditions being recorded.
As I noted in recent writing, the currency pair whipsawed through $0.69 and touched gloves with H1 prime support at $0.6863-0.6892. This is a textbook stop-run scenario and has served well thus far. H1 resistance consequently demands attention at 0.6960, while continuation buying unearths H1 prime resistance at $0.7029-0.6984 and, of course, the widely watched $0.70 figure established within.
Given psychological values are prone to whipsaws, particularly big figures like $0.70, a run above the number could play out if we retest H1 prime resistance, which may trigger bearish flow. However, do bear in mind that circling just above the H1 zone is H4 prime resistance drawn from $0.7062-0.7031, indicating a whipsaw of $0.7029-0.6984 is also possible.
Technical expectation
A whipsaw of $0.70 within the H1 prime resistance at $0.7029-0.6984 remains a potential scenario for me. Alternatively, a whipsaw of the H1 zone into H4 prime resistance at $0.7062-0.7031 is another scenario I will be watching closely for this week.
Both setups are considered bearish, in line with the overall downtrend this market is in right now.
USD/JPY
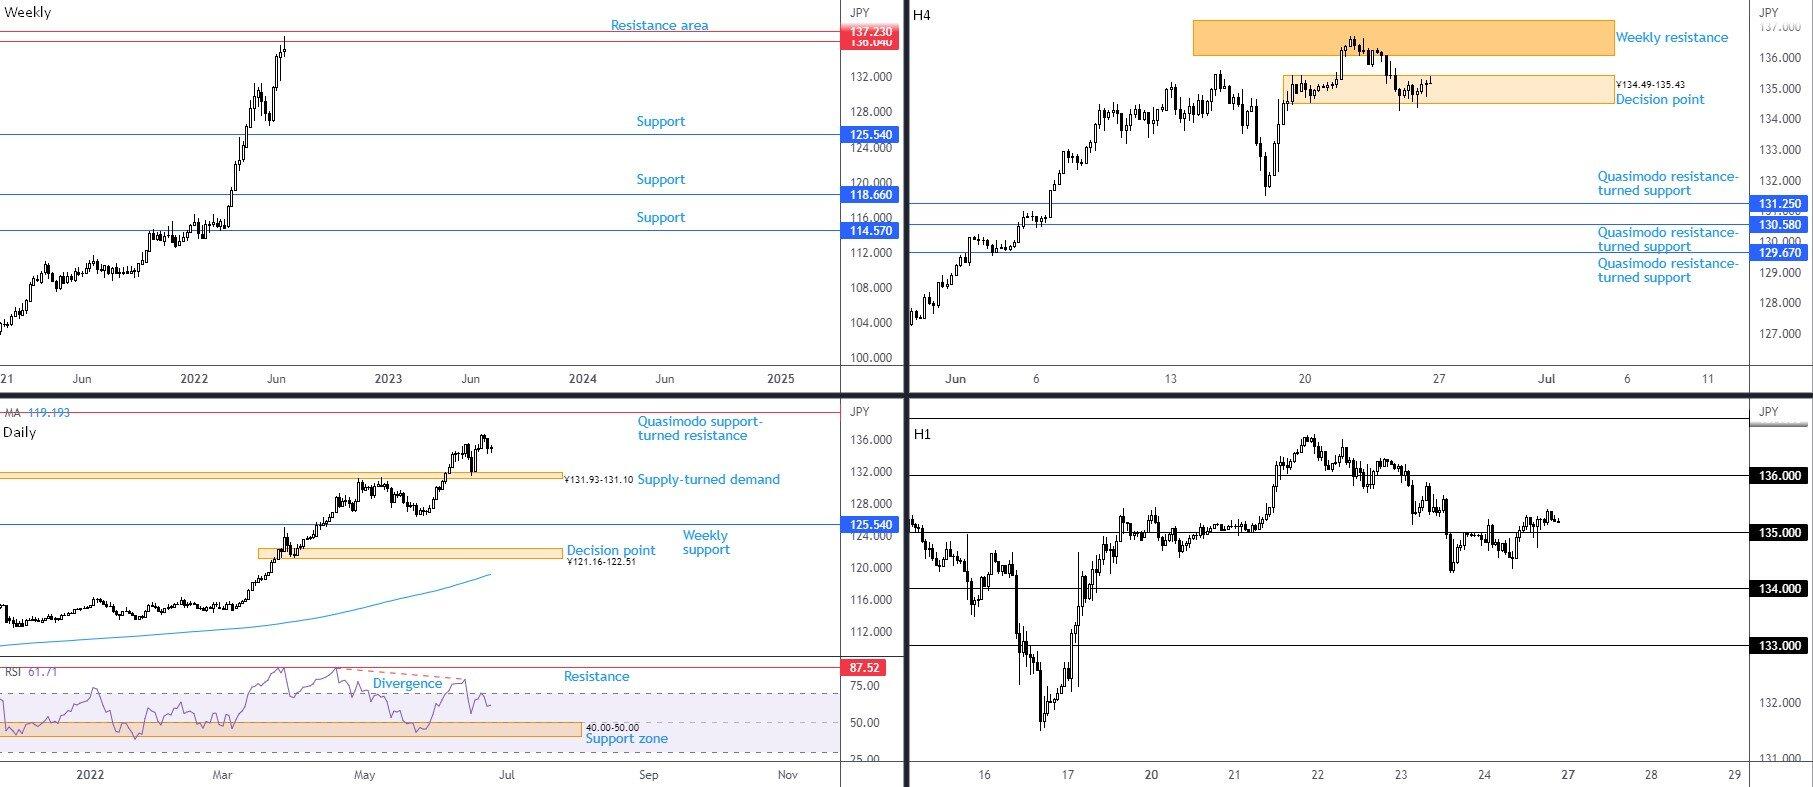
Month to date, the currency pair is higher by more than 5.0 per cent. Aside from a momentary pause in May, the recent advance follows March and April’s mammoth gains (5.8 per cent and 6.7 per cent, respectively), in a market that’s been trending higher since 2021. However, despite the USD/JPY touching highs at ¥136.71 (levels not seen since 1998), momentum noticeably slowed in recent trading. Last week’s action printed a half-hearted shooting star (bearish) candlestick pattern from weekly resistance, made up between ¥137.23 and ¥136.04. Support, for those looking lower, remains obvious at ¥125.54 (tucked under the ¥126.36 swing low [24th May]).
Supply-turned demand at ¥131.93-131.10 on the daily chart merits consideration as price responded from the zone in mid-June. While current weekly resistances are on my immediate radar, the daily timeframe throws up another resistance alternative just above the weekly lines at ¥139.55, a Quasimodo support-turned resistance.
The current weekly resistances also remain the main focus on the H4. After a dip from the weekly resistance zone, a H4 decision point from ¥134.49-135.43 greeted price in the second half of the week, and, although held ground, did suffer attacks at its lower limit. Typically, I would interpret this as a bearish indication; H4 buyers struggling to confront selling pressure from the weekly timeframe’s resistance. But, having seen H1 price reclaim ¥135+ status (and retest the level as support) on Friday, together with room to climb on the daily timeframe (to ¥139.55) in a market clearly trending northbound, buyers may still be in the driving seat.
Technical expectation
Given the H4 decision point at ¥134.49-135.43 remains in position, supported by the current uptrend, along with scope to press higher on the daily chart, buyers likely have the upper hand as long as H1 price maintains position above ¥135 this week. This, therefore, unlocks things for a run to ¥136.
GBP/USD:
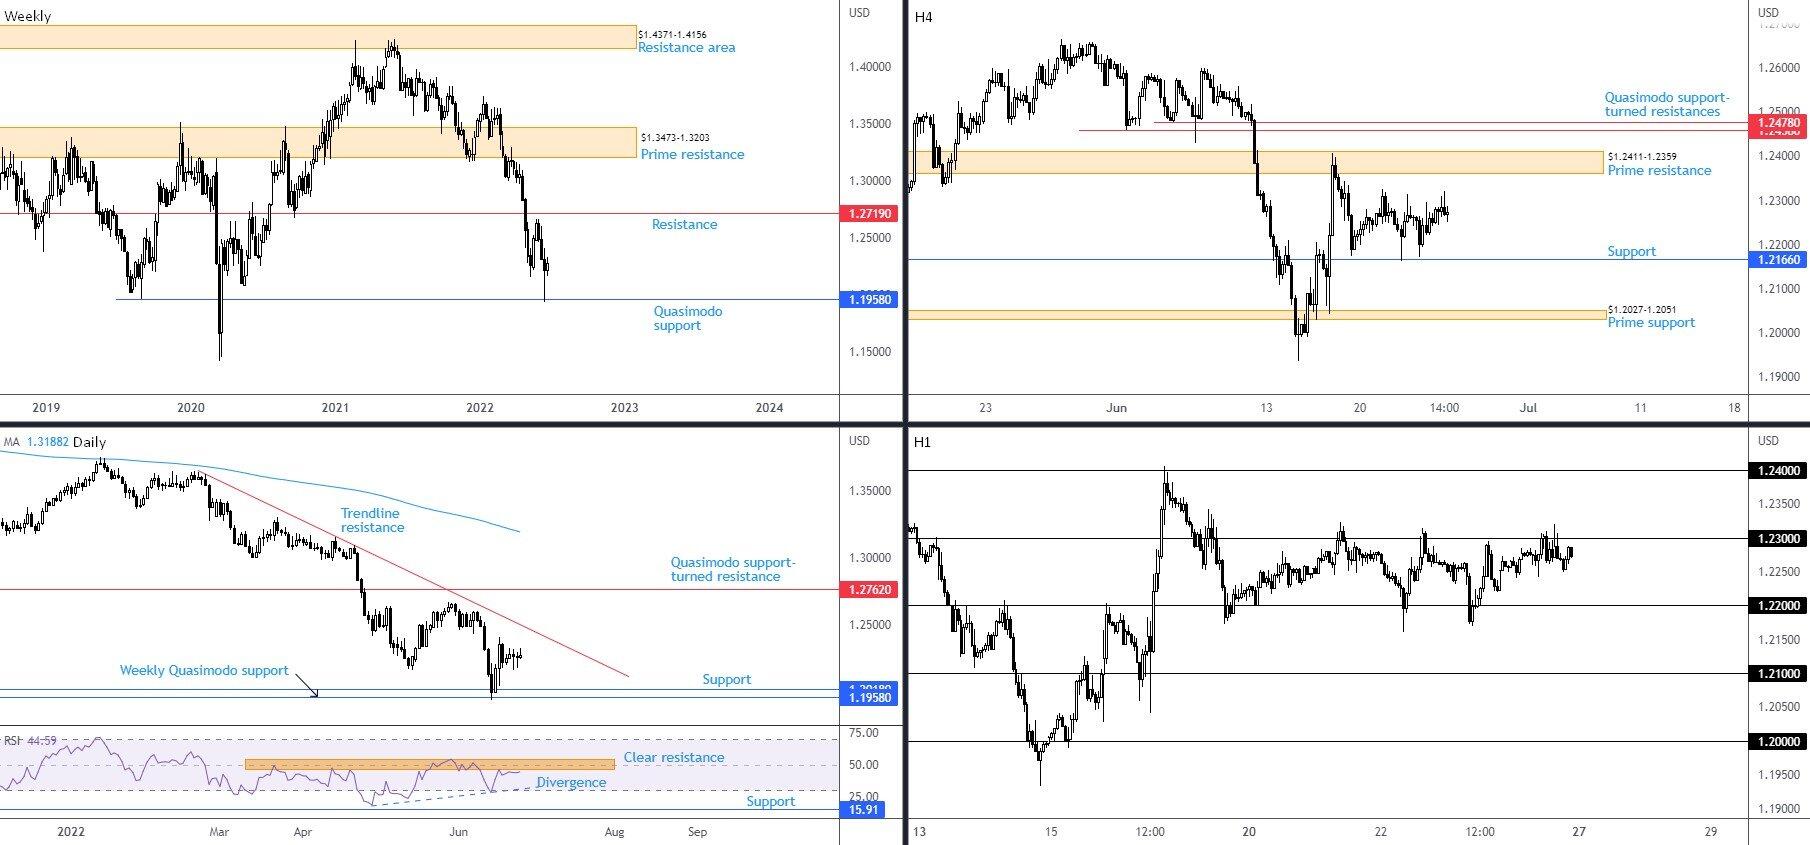
Sterling finished the week on the front foot versus the US dollar, adding 0.4 per cent and trimming a three-week losing streak. This comes after the prior week’s high-spirited recovery from weekly Quasimodo support at $1.1958 that fashioned a noticeable lower candle shadow (this is not a bullish hammer pattern but invites bullish undertones given the size of the lower shadow). Though the week did indeed conclude higher, the move lacks conviction and is unlikely going to drum up sufficient backing to reach weekly resistance at $1.2719.
Trend direction in this market is unmistakably bearish, fashioning a series of lower lows/highs since February/May’s double-top formation at around $1.4241. Furthermore, seen through the monthly timeframe, the long-term downtrend has actually been soft since late 2007 tops at $2.1161.
A closer reading of price action on the daily timeframe shows price action has been operating south of its 200-day simple moving average at $1.3188 since 17th September 2021—a bearish signal for many technical analysts. Trendline resistance, taken from the high $1.3639, is close at hand, with a break of this descending line communicating the possibility of testing daily Quasimodo support-turned resistance at $1.2762, and, by extension, weekly resistance at $1.2719. A final point on the daily timeframe, we can see the relative strength index (RSI) is testing resistance around the 50.00 centreline, following positive divergence. Voyaging above 50.00 is a sign of positive momentum and could push for a test of the noted trendline resistance.
Moving a little lower on the curve, H4 price action, following its one-sided decline from prime resistance at $1.2411-1.2359 (arranged below two Quasimodo support-turned resistance levels at $1.2478 and $1.2458), movement has been relatively stable from support at $1.2166. Territory below here has prime support at $1.2027-1.2051 to target. On the H1 timeframe, the action has been centred between $1.23 and $1.22, forming a clear rangebound environment since 17th June. Outside of this range, traders will be watching $1.24 to the upside and $1.21 to the downside.
Technical Expectation:
The reaction from weekly Quasimodo support at $1.1958 may encourage buying to draw price towards daily trendline resistance this week. It is here that sellers may decide to put on a show, in keeping with the overall downtrend. This translates to a possible $1.23 breach to the upside in the short term, and possible rally to at least $1.24.
Author

Aaron Hill
FP Markets
After completing his Bachelor’s degree in English and Creative Writing in the UK, and subsequently spending a handful of years teaching English as a foreign language teacher around Asia, Aaron was introduced to financial trading,


