USDJPY - Profitable Opportunity Just Ahead of the Bulls?

Despite the Thursday’sclosure below the lower border of the consolidationand the Friday's drop to the lowest level for more than two weeks, the bulls kept cool and reborn in recent days, erasing almost entire recent move to the downside. Will the pro-growth formation that is drawing on the horizon encourage them to fight for higher values of USD/JPY in the coming days?
EUR/USD – Similarity to July
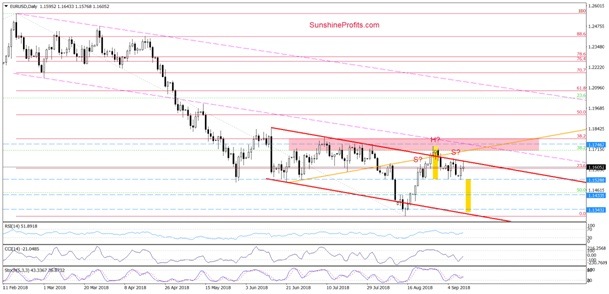
Although EUR/USD moved a bit higher earlier today, the upper border of the red declining trend channel stopped the buyers once again, triggering another pullback.
When we take a closer look at the daily chart, we clearly see that similar situation we observed at the end of July, which increases the probability that the next bigger move will be to the downside and lower values of the exchange rate are just around the corner.
Taking all the above into account, we believe that one more test of the blue dashed horizontal line is more likely than not (as a reminder, this is a potential neck line of the head and shoulders top formation).
What could happen if we see a breakdown under this support?
In our opinion, EUR/USD will extend its decline not only to our initial downside target butwill also test the recent lows (in terms of daily closures) or even the lower line of the red declining trend channel in the following days.
USD/JPY - Chance for Bulls
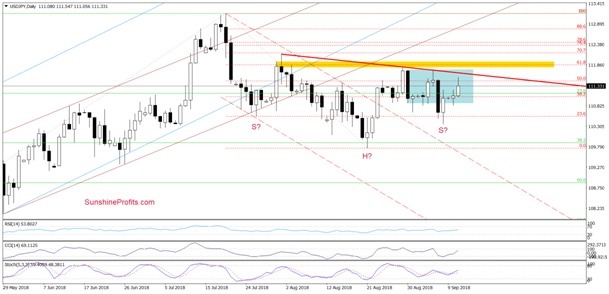
On Friday, the exchange rate invalidated the Thursday’s breakdown under the lower border of the blue consolidation, which encouraged currency bulls to act.
Earlier today, USD/JPY extendedgains, which suggests that we’ll see a realization of yesterday’s scenario (an increase to at least the upper border of the above-mentioned formation) in the very near future. Nevertheless, before we see such price action, the buyers will have to break above the red declining resistance line based on August peaks.
How important could this line be for the future of the bulls?
As you see on the above chart, it could be the neck line of a potential reverse head and shoulders formation. Therefore, if currency bulls manage to break above it, we could see an upward move not only above the yellow resistance zone (created by the 61.8% Fibonacci retracement and the highs that we saw at the turn of July and August), but also a test of the July peaks or even a rally to around 114, where the size of the increases will correspond to the height of the above-mentioned formation.
What’s interesting, in this area is also the lower border of the orange resistance zone (seen on the weekly chart below), which stopped the buyers several times in the past.

Therefore, if we see a confirmed breakout above the red resistance line and the upper line of the blue consolidation, we’ll likely open long positions (of course, if there are no other technical contraindications to this). We will keep our subscribers informed should anything change, or should we see a confirmation/invalidation of the above.
USD/CHF Meets Its First Resistance
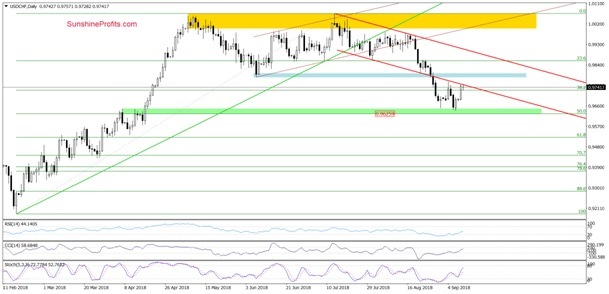
On Friday, we wrote that taking into account, the (…) support area, it seems to us that (…), the space for declines is limited and we’ll see a reversal and rebound at the beginning of the upcoming week.
(…) If the situation develops in line with this assumption, USD/CHF will (…) re-test the strength of the lower border of the red declining trend channel in the very near future.
Yesterday, currency bulls implemented the above scenario and the exchange rate increased to the lower line of the red declining trend channel. Earlier today, we saw one more attempt to move higher, but despite this upswing, the sellers managed to stop their opponents and triggered a pullback, which invalidated a tiny breakout above this resistance.
Such price action suggests that currency bears are quite active in this area and as long as there is no confirmed (by a daily closure) invalidation of the earlier breakdownhigher values of USD/CHF are questionable and correction of the recent rebound should not surprise us.
Want free follow-ups to the above article and details not available to 99%+ investors? Sign up to our free newsletter today!
Author

Paul Rejczak
Sunshine Profits
Paul Rejczak is a stock market strategist who has been known for the quality of his technical and fundamental analysis since the late nineties.


