USDJPY looks overbought

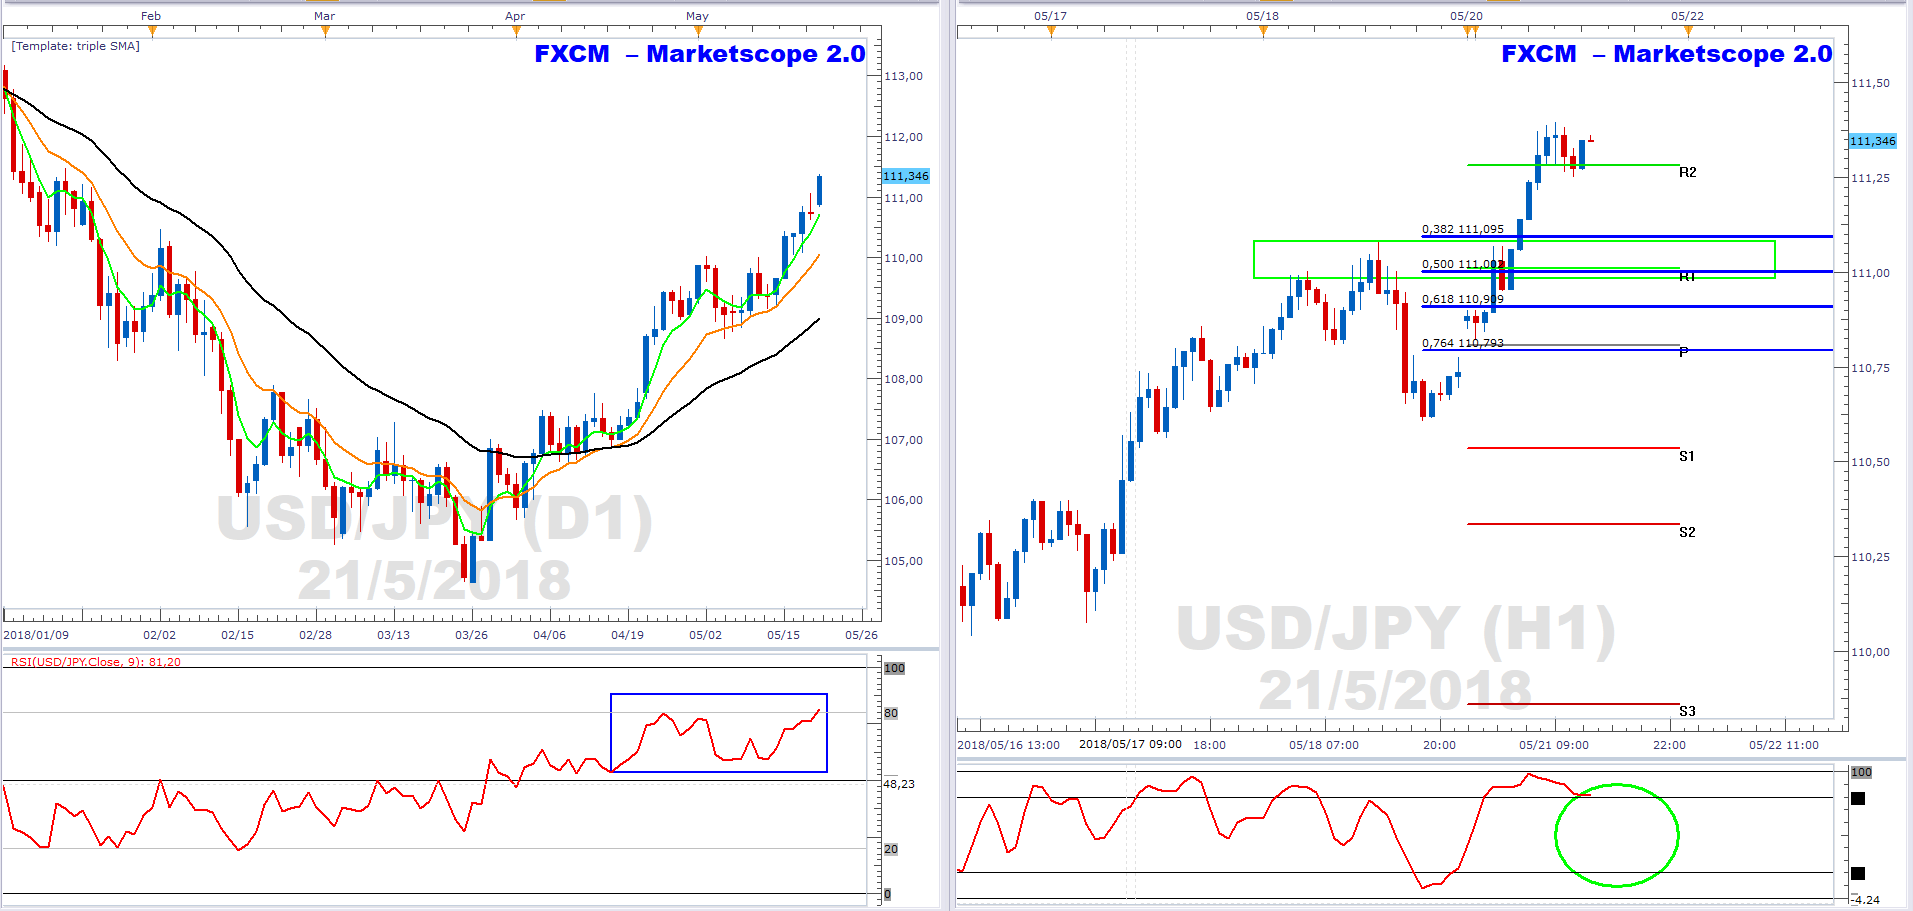
The USDJPY is in a mark-up phase. This phase is typically defined by a bullish EMA formation. I.e. the green 5-day EMA > the orange 13-day EMA > the black 34-day EMA. Moreover, the RSI(9) is above 50 and indicative of bullish momentum (blue rectangle). However, it is also above the 80 level, which is regarded as overbought.
As such, key support with a confluence of factors is potentially to be found below current price action. This includes the R1 pivot level, price support (green rectangle) and the 50% Fibonacci retracement. The stochastic needs to move from an overbought to an oversold level (green ellipse).
Author

Russell Shor (MSTA, CFTe, MFTA) has an Honours Degree in Economics from the University of South Africa and holds the coveted Certified Financial Technician and Master of Financial Technical Analysis qualifications from the Interna


