USD/CHF climbs higher after the false bearish breakout from the triangle

Today, let’s talk about USDCHF, which for almost a year, was in an extremely boring sideways trend. In the beginning, it was fine, because swings were pretty significant, but the giant symmetric triangle was narrowing and the latest price changes were almost invisible. For example, look at the orange rectangle. No direction whatsoever.
The situation changed a bit recently. At the end of last year, sellers managed to take initiative and the price broke the lower line of the triangle. Normally, that should give us a proper, long-term sell signal. I mean it did, but it happened to be a fake one (red rectangle).
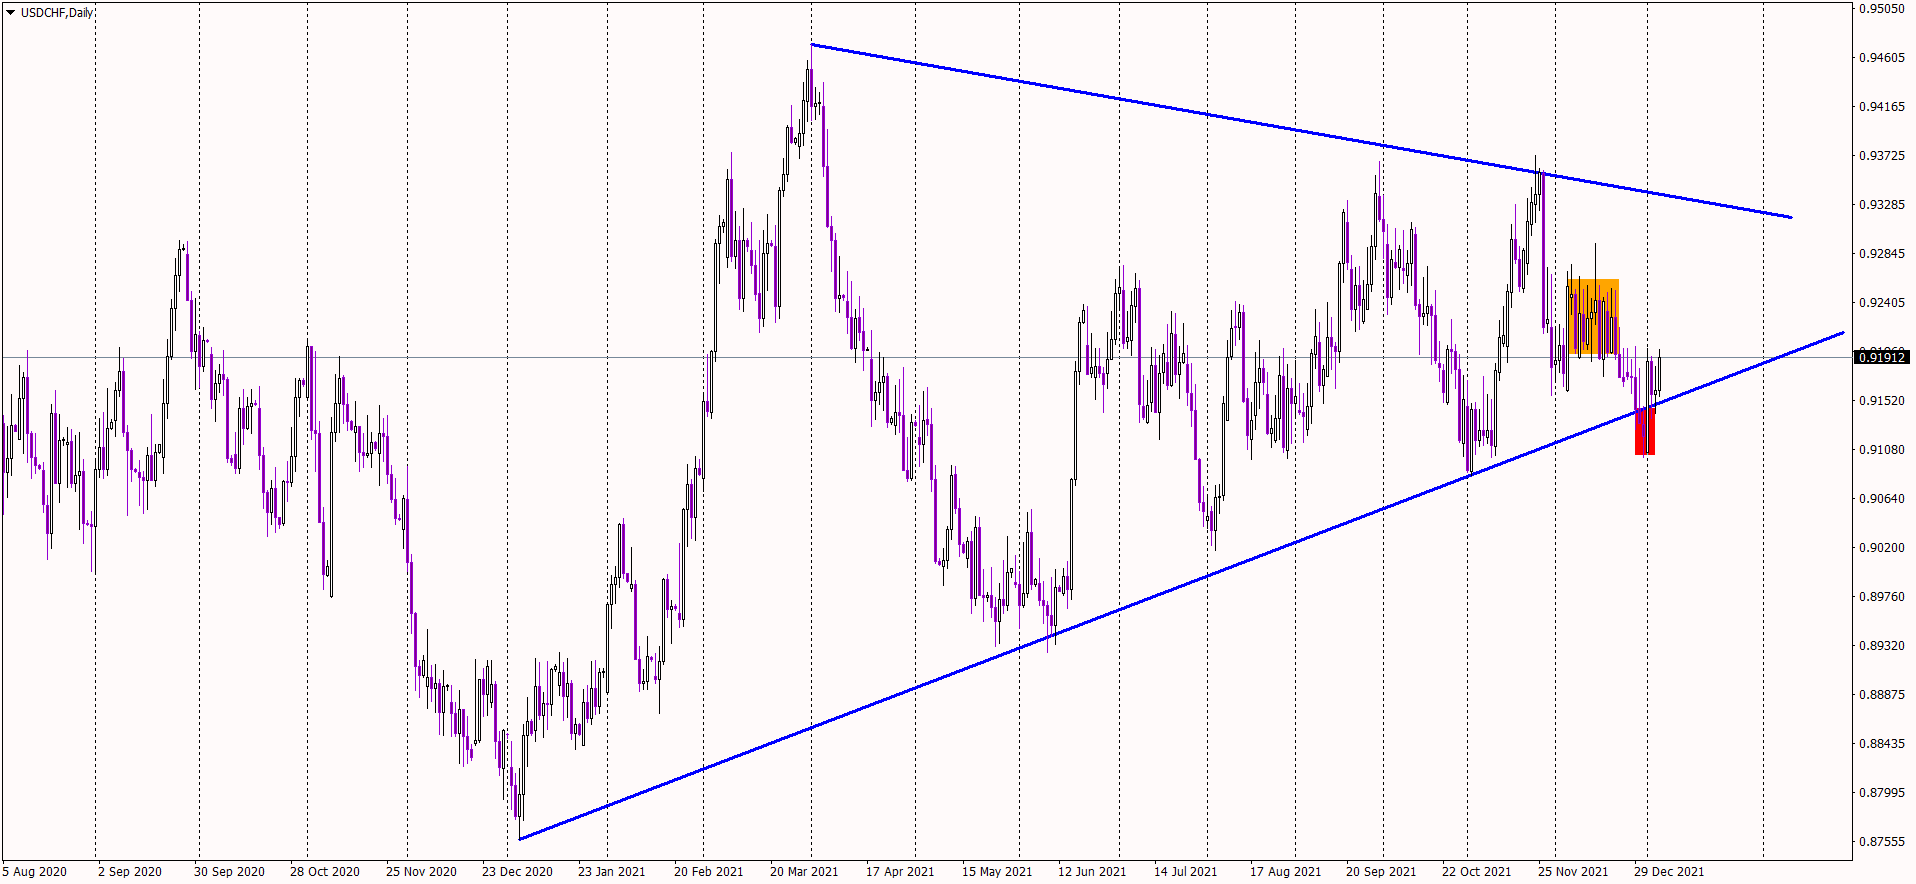
How is that helping us? Well, false breakouts can be great trading opportunities in themselves. Yes, initially you are caught in a movement in the wrong direction but the comeback gives you a chance to close your losing trade and open one in the opposite direction. Usually, false breakouts give amazing signals to the other side. So, in theory, when we had breakout to the downside, now we should see a few bullish days or even weeks.
With the price being back inside of the triangle. The next direction should be the upper line of this pattern, which leaves us a lot of space to jump into a bullish trade. As long as the price stays above the lower line of the triangle. The sentiment is positive.
Author

Tomasz Wisniewski
Axiory Global Ltd.
Tomasz was born in Warsaw, Poland on 25th October, 1985.


