|

Silver price analysis: Sharp rejection from resistance signals further downside risk [Video]

Silver is moving lower after reacting precisely to the resistance zone between 85 and 90, highlighted previously as a key supply area. From this region, the market has produced a sharp and impulsive selloff, indicating strong selling pressure rather than a corrective pullback.

The structure of the decline suggests that this move is likely part of wave D within a broader corrective formation. Wave D in such structures typically unfolds in three waves, which implies that the current downside phase may not yet be complete.

silver4h
XAGUSD(silver) 4H Chart

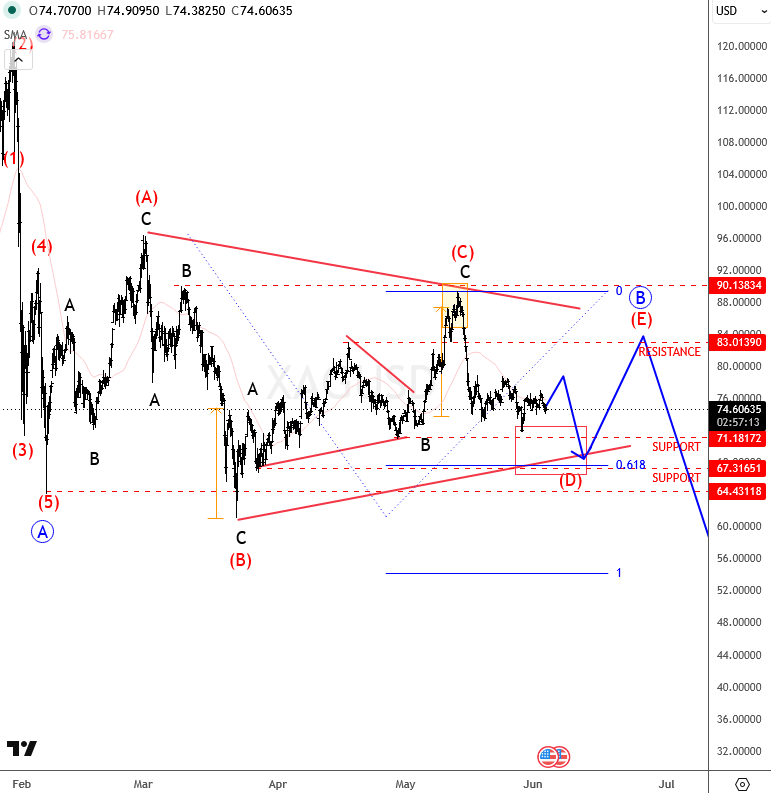
Given this interpretation, further weakness remains a high-probability scenario. Price action could extend lower toward the previous subwave B swing lows, where a significant support zone is expected between 67 and 72. This area may act as a temporary stabilizing region if buyers step in.

Overall, the broader structure still appears consistent with a higher-degree triangle formation, meaning the market may remain range-bound over time. However, the current momentum confirms that the decline from the February highs is still in progress.

If selling pressure continues, bears may retain control for the remainder of the year, with a deeper structural support level visible around the 50 area on the daily timeframe.

For a detailed view and more analysis like this, you can watch below our latest recording of a live webinar streamed on Junst 1st:

Youtube preview

Get Full Access To Our Premium Elliott Wave Analysis For 14 Days. Click here.

Author

Gregor Horvat

Gregor Horvat

Wavetraders

Experience Grega is based in Slovenia and has been in the Forex market since 2003.

More from Gregor Horvat
Share:

Editor's Picks

AUD/USD eyes 0.7150 barrier nine-day EMA

AUD/USD inches higher after registering modest losses in the previous day, trading around 0.7130 during the Asian hours. The technical analysis of the daily chart indicates that the pair is moving sideways within the rectangle pattern, suggesting a consolidation as neither the bulls nor the bears have enough momentum to take control of the market.

USD/JPY trades below 160.00 intervention threshold; bullish bias intact

The USD/JPY pair attracts some sellers during the Asian session amid fears that authorities will step in again to prop up the Japanese Yen. Furthermore, the Israel-Lebanon truce prompts some profit-taking around the US Dollar and exerts downward pressure on the currency pair.

Gold meets contention near $4,420…for now

Gold extends its recovery past the $4,500 mark per troy ounce on Thursday. The yellow metal’s advance comes amid the resurgence of some selling interest around the, improving risk sentiment, and declining US Treasury yields across the curve.

Bitcoin’s massive storm is back: Why the sell-off is far from over

Bitcoin price action over the last few weeks has felt less like a normal, healthy correction and more like a slow grinding crash that continues to wreak havoc on holdings and trading accounts. And everything suggests that the dramatic crash isn’t over.

Nonfarm payrolls: Testing the limits of Fed policy patience

The upcoming nonfarm payrolls report for May will provide the final update on the US labor market before Kevin Warsh attends his first policy meeting as the new Fed Chair later this month.

Recession on paper: What really moves the Canadian Loonie now?

Statistics Canada handed the headline writers a gift and the analysts a headache. Real GDP shrank 0.1% on an annualized basis in the first quarter, and with the fourth quarter of 2025 revised down to a 1.0% contraction, that is two negative quarters in a row, the textbook definition of a technical recession and Canada's first since the pandemic.