|

$USD/SEK and $USD/MXN holding the $USDX [Video]

The $USDX peaked back on 09.29.2022. Since then, the Index has been dropping. The Index is at risk of ending the cycle since the lows back in 2008. This means a huge selling could be happening now. We explained the idea in this article, published on 09.21.2022. We knew the $USDX was about to enter wave 4. At this stage, that’s where we think the Index is. Wave four should still extend lower due to bearish sequence in pairs like the $USDSEK and $USDMXN. Both these pairs have not yet reached the target within their own sequence. The $USDMXN peaked on 04.2020. Since then, it has been doing an ABC lower. It already erased the divergence between A and C, but it has not yet reached the ideal Blue Box target.

Monthly USD/MXN Elliott Wave chart

Chart

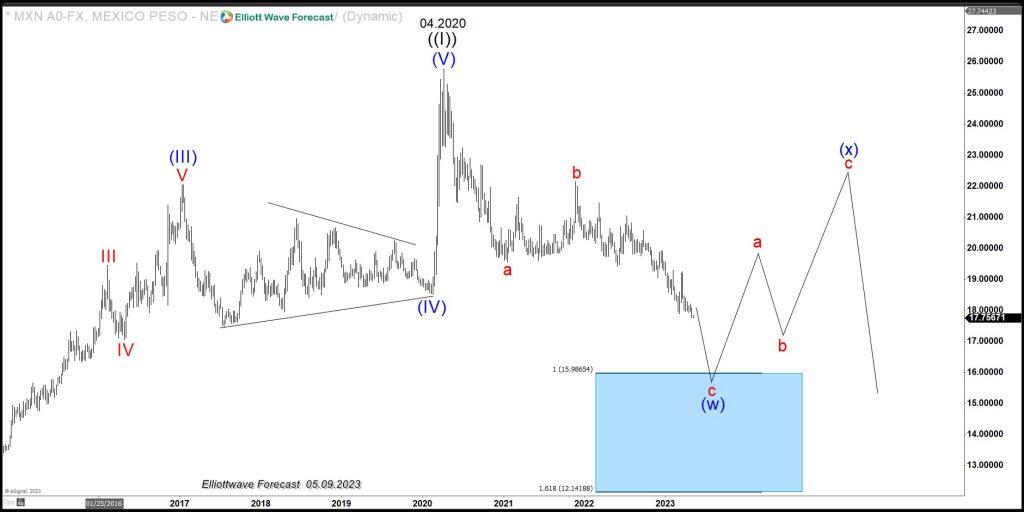
The chart above shows the monthly view of the $USDMXN and the blue box target where buyers should enter the market. The $USDSEK also shows a bearish sequence from the peak on 09.28.2022. It shows two channels, and the second one comes with momentum divergences. The decline from the peak has a corrective structure, which we labeled as WXY. Now we are entering wave Y leg, which should also reach the extreme. We expect both pairs to trade lower. If that is the case, $USDX should be weak consequently.

Daily $USD/SEK Elliott Wave chart

Chart

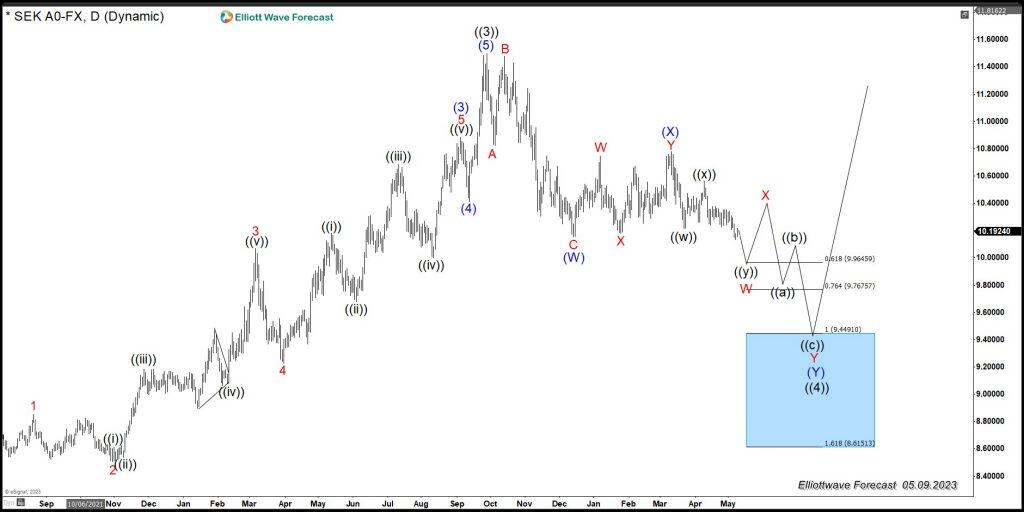
The chart above shows the $USDSEK Daily view and how the pair should move. The divergence between wave (W) and (Y) needs to be erased by the time we reach the blue box target.

$USD/SEK and $USD/MXN Elliott Wave video

Author

Elliott Wave Forecast Team

Elliott Wave Forecast Team

ElliottWave-Forecast.com

More from Elliott Wave Forecast Team
Share:

Editor's Picks

EUR/USD looks offered below 1.1900

EUR/USD keeps its bearish tone unchanged ahead of the opening bell in Asia, returning to the sub-1.1900 region following a firmer tone in the US Dollar. Indeed, the pair reverses two consecutive daily gains amid steady caution ahead of Wednesday’s key US Nonfarm Payrolls release.
 

GBP/USD slips back to daily lows near 1.3640

GBP/USD drops to daily lows near 1.3640 as sellers push harder and the Greenback extends its rebound in the latter part of Tuesday’s session. Looking ahead, the combination of key US releases, including NFP and CPI, alongside important UK data, should keep the pound firmly in focus over the coming days.

Gold the battle of wills continues with bulls not ready to give up

Gold remains on the defensive and approaches the key $5,000 region per troy ounce on Tuesday, giving back part of its recent two day. The precious metal’s pullback unfolds against a firmer tone in the US Dollar, declining US Treasury yields and steady caution ahead of upcoming key US data releases.

Bitcoin's downtrend caused by ETF redemptions and AI rotation: Wintermute

Bitcoin's (BTC) fall from grace since the October 10 leverage flush has been spearheaded by sustained ETF outflows and a rotation into the AI narrative, according to Wintermute.

Dollar drops and stocks rally: The week of reckoning for US economic data

Following a sizeable move lower in US technology Stocks last week, we have witnessed a meaningful recovery unfold. The USD Index is in a concerning position; the monthly price continues to hold the south channel support.

XRP holds $1.40 amid ETF inflows and stable derivatives market

Ripple trades under pressure, with immediate support at $1.40 holding at the time of writing on Tuesday. A recovery attempt from last week’s sell-off to $1.12 stalled at $1.54 on Friday, leading to limited price action between the current support and the resistance.