USD/NOK completes a corrective recovery [Video]
![USD/NOK completes a corrective recovery [Video]](https://editorial.fxsstatic.com/images/i/Norway_XtraLarge.png)
USDNOK made some recovery recently, but in three legs only, which indicates for a correction within the downtrend by Elliott wave theory, called a zig-zag. It stopped perfectly at equal wavelength of waves (A)=(C) and at the channel resistance line, so bears can be back, especially if it breaks below 10.0 level.
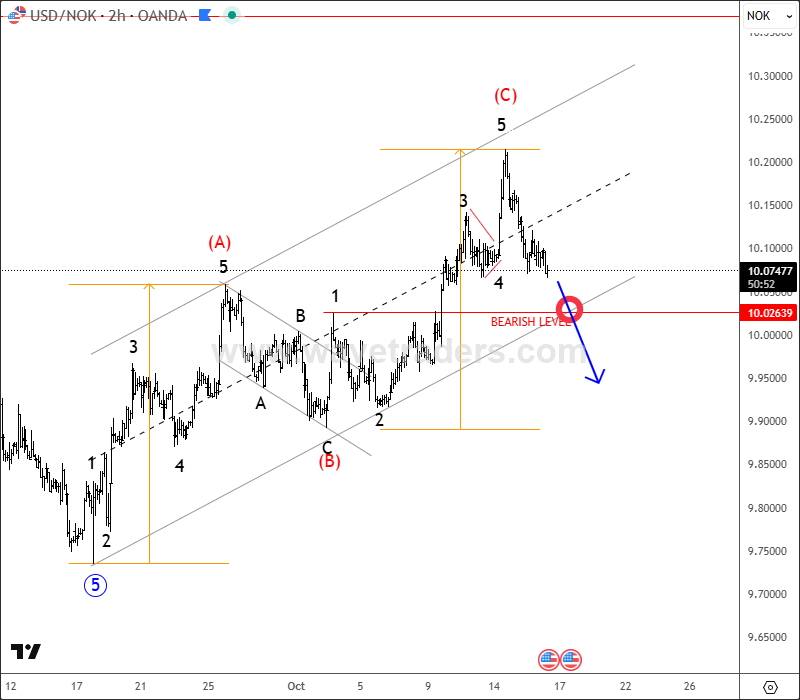
USD/NOK two-hour chart
A zig-zag correction within a bearish trend is a temporary upward retracement that moves against the main downtrend. It follows the A-B-C (5-3-5) structure, where waves A and C are impulsive bullish moves, while wave B is a smaller bearish correction between them. It represents a sharp countertrend rally within a larger bearish cycle, after which the main downtrend typically resumes.
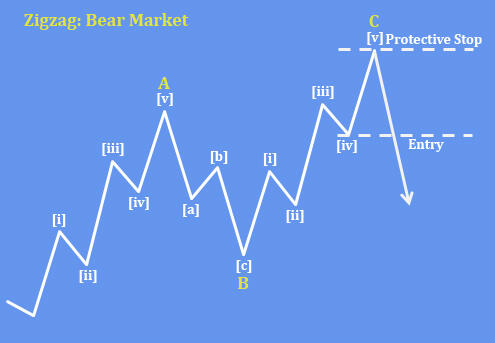
Basic Zig-Zag corrective pattern
For more analysis like this, you can watch below our latest recording of a live webinar streamed on October 13:
Get Full Access To Our Premium Elliott Wave Analysis For 14 Days. Click here.
Get Full Access To Our Premium Elliott Wave Analysis For 14 Days. Click here.
Author

Gregor Horvat
Wavetraders
Experience Grega is based in Slovenia and has been in the Forex market since 2003.


