USD/JPY Weekly Forecast: There is no hiding from bond yields
- BOJ makes no changes in rate policy or bond purchases.
- BOJ widens range on long-term rates to 0.25% around zero.
- Federal Reserve stands pat but the US yield curve continues to steepen.
- US 10-Year Treasury yield climbs above 1.7%, a 14-month high.
- FXStreet Forecast Poll predicts returning yen strength

Central banks dominated the market news this week but US yields controlled the action.
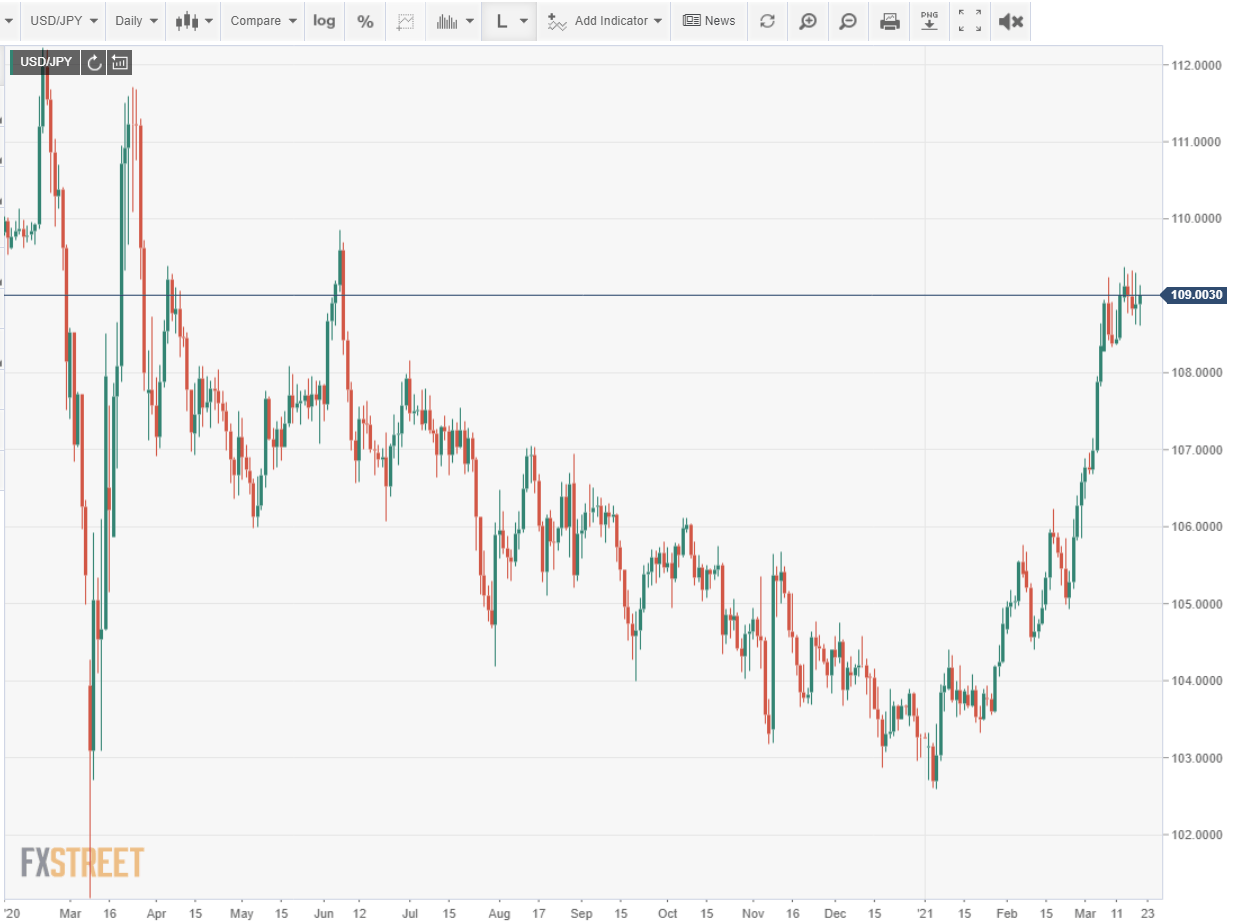
The USD/JPY has consolidated over the last two weeks. After climbing 6% from its low at 102.70 on January 5 to 108.90 on March 8, the closing ranges have been less than a figure, from 108.38 on March 10 to 109.13 on March 15.
The yield on the US 10-year Treasury added 64 basis points to 1.595% during that initial period, its steepest gain since the second half of 2016. In the subsequent two weeks the return has climbed 14 points to 1.739% on March 19.
US 10-Year Treasury yield
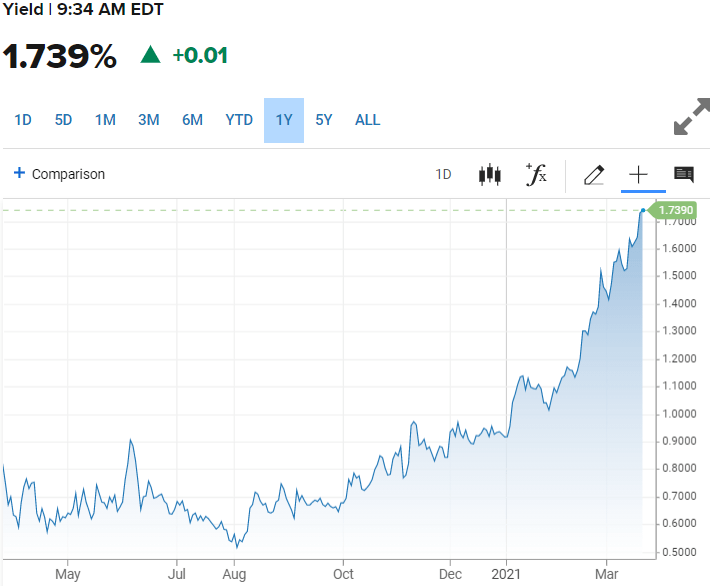
CNBC
The Bank of Japan (BOJ) widened the band for long-term rates to 0.25% around a 0% mid-point from the implicit 0.2% current range. The change is designed to give the BOJ's yield curve control (YCC) policy greater flexibility. The bank also withdrew its guarantee to buy six trillion yen ($55.21 billion) of exchange-traded funds (ETF) annually. The bank said it would only intervene when stock markets destabilize under the 12-trillion yen cap set during the pandemic panic last year.
In his news conference following the rate announcement, Governor Haruhiko Kuroda insisted that the bank was not exiting from its easy money policies and that the BOJ is ready to further ease monetary conditions if necessary. “We won't tolerate yield fluctuations that would have an impact on our monetary easing,” he told the reporters.
The policy change was widely expected and had no currency impact.
Since the bank announced a review in December US Treasury yields have far outstripped those of Japanese Government Bonds (JGB) and the USD/JPY has risen 5.5% in the New Year.
As the largest holder of JGBs and stocks, small BOJ purchase adjustments can have major implications in Japanese markets but their impact on the USD/JPY has been easily overshadowed by US interest rates.
The BOJ left the overnight call rate unchanged at -0.1% and the target rate for the 10-year JGB at 0% as universally predicted.
In the past 12 years the bank has adjusted the overnight call rate just three times, twice during the financial crisis, in October 2008 from 0.5% to 0.3% and that December to 0.1%. Since then the sole move has been to -0.1% in January 2016 where it has remained.
Wednesday's Federal Reserve meeting had more interest though few fireworks.
The central bank raised its growth estimate for 2021 more than 50% from 4.2% to 6.5%. Unemployment at the end of this year is now expected to be 4.5% instead of 5%, down from its current 6.2%.
Core Personal Consumption Expenditure inflation (PCE) is projected to reach 2.2% in 2021, December's estimate was 1.8%. The Fed issues its Projection Materials four times a year in March, June, September and December. The fed funds rate was unchanged at 0.25% and bond purchases remained at $120 billion a month.
The steepening of the US yield curve that has been underway in earnest since January is the most important market development this year. It is the natural credit market response to potential inflation, to the probability of a strong US economic rebound and to the artificially low rates forced by the Fed's pandemic policy.
From the close on December 31 to Thursday's finish the 2-10 spread, the difference between the yield of the 2-year Treasury and the 10-year, has almost doubled from 79 basis points to 154 points.
At year end the 2-year return was 0.123% and the 10-year was at 0.916%. Since then the 10-year has jumped to 1.706% (March 18) but the 2-year has barely moved adding just over 3 points to 0.157% (March 18).
The Fed is actively suppressing the short end of the curve with its bond purchases and forward guidance on the fed funds rate, which its own projections list unchanged until the end of 2023.
Fed governors and Chairman Powell have said the US economic recovery and the full return of the labor market will not be impeded by higher rates at the longer end of the yield curve. Credit markets have taken that as permission to sell Treasuries. Bond prices move inversely to yields to account for the fixed coupon rate.
From October 2016 to August 2019 the 10-year yield was above 2% and from January 2018 to March 2019 it was above 2.5%. The US economy averaged about 2.5% annual growth in 2017, 2018 and 2019. This year's expected GDP rate of 6.5% is more than twice as fast as those years. The Fed's confidence seems well placed given the pace of the US expansion.
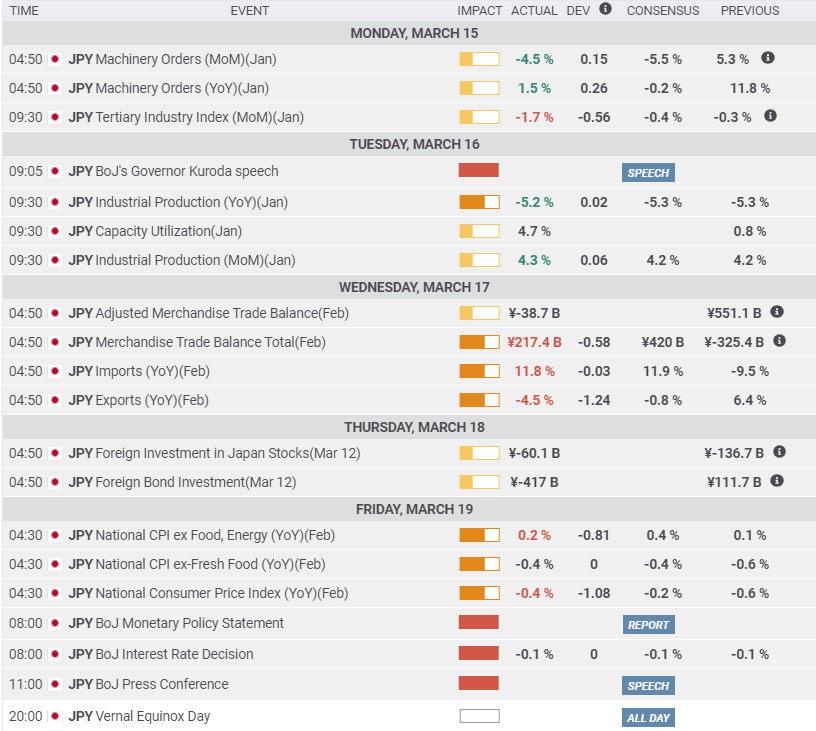
Japanese statistics were largely as expected with no indication of an acceleration in the economy despite the waning pandemic in Dai Nippon, and no support for the yen.
Annual Industrial Production decreased for the 16th straight month. Imports rose in February but Exports sank much more than expected. Yearly deflation moderated in February but price changes were still negative for the fifth straight month.
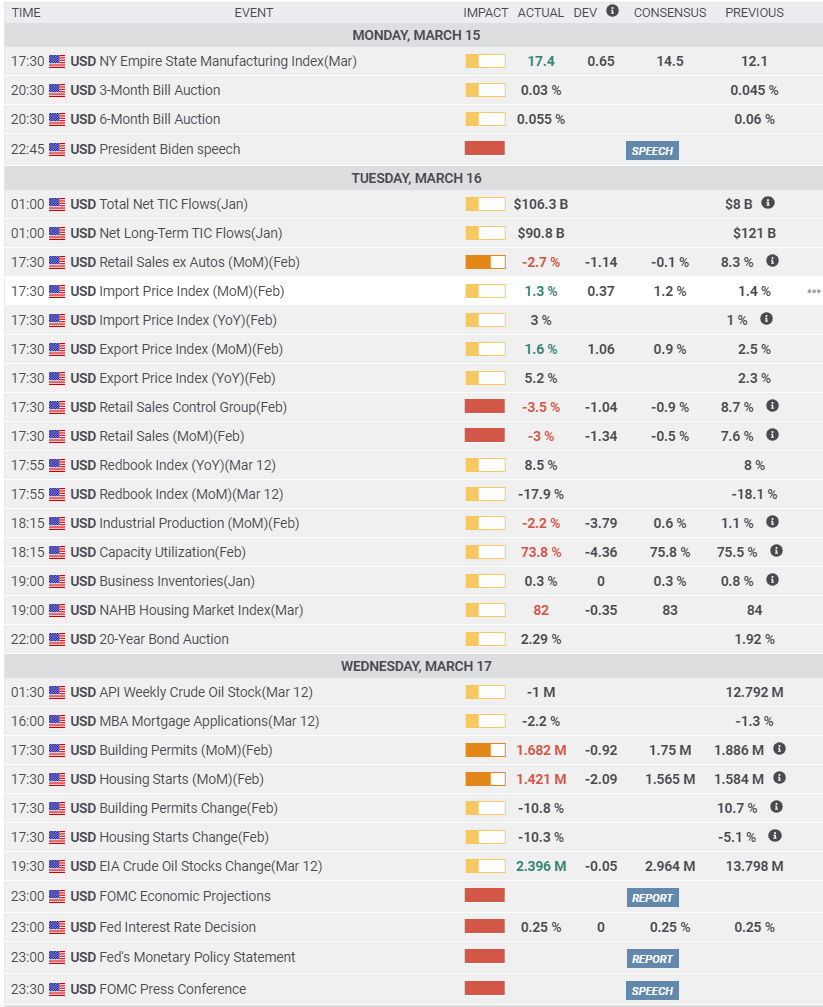
In the, US February Retail Sales disappointed but were mitigated by strong revisions to the January totals and expectations of a demand surge from the recent $1.9 trillion stimulus package. Industrial Production unexpectedly fell in February as did Capacity Utilization. The home construction industry cooled in February but from an unusually high level. Jobless Claims rose, perhaps from the harsh winter weather in the central part of the country, though a decline had been predicted.
USD/JPY outlook
Treasury rates continue to direct trading and provide the logic for the USD/JPY. The higher shift of the US yield curve without a balancing move in Japan has put the yen on the extreme defensive with the sharpest losses since the fall of 2017. The weaker yen will assist the Japanese economy to recover from the pandemic, hence the complacency of the BOJ, which has eschewed its usual warning about rapid currency movements.
Expectations for accelerated US economic growth are behind the rise in Treasury yields and while those forecasts, including that of the Fed, seem realistic, data is lacking.
In the week ahead, Durable Goods Orders for February will likely confirm the Retail Sales decline, without providing new information. Nondefense Capital Goods, the business investment analog, will give an indication if managers remain positive about economic prospects.
Technical analysis shows the USD/JPY has good support at 108.50 and at 107.90. Immediate resistance at 109.35 and 109.65 is weak. The early pandemic plunge and recovery from late February to late March last year will give little pause one way or another, the traded volumes on those panicky days were far too thin for positioning.
It is the direction of US Treasury yields, particularly the 10-year which has received much attention lately, that should direct the USD/JPY higher. American economic data marks time this week. The rosy assumptions on US growth will survive at least to the next payroll report on April 2.
Japan statistics March 15-March 19
Monday
Machinery Orders fell 4.5% on the month and rose 1.5% on the year in January from 5.3% and -0.3% in December. The Tertiary Index, which logs the domestic service sector, fell 1.7% In January, much more than the -0.4% estimate and December's 0.3% loss.
Tuesday
Industrial Production rose 4.3% in January on a 4.2% forecast and the same in December. Annual production fell 5.2% on a -5.3% forecast and December result.
Wednesday
Imports rose 11.8% in February after falling 9.5% prior. Exports dropped 4.5 in February, much more than the -0.8% forecast. They rose 6.4% in January.
Friday
National CPI (YoY) slipped -0.4% in February, twice the forecast, after -0.6% in January. Core CPI (YoY) rose 0.2%, half its forecast, following the 0.1% gain in January. CPI ex Fresh Food was -0.4%, as expected, after -0.6% in January.
US statistics March 15-March 19
Tuesday
Retail Sales dropped 3% in February, far more than the -0.5% forecast but January was revised from 5.3% to 7.6%, almost the exact amount of the negative overshoot. Sales ex Autos dropped 2.7% on a -0.1% forecast but here too the 2.4% upward revision to 8.3% in January balanced the disappointment. Retail Sales Control Group, the GDP consumption proxy, fell 3.5% in February on a -0.9% estimate and the revision pattern continued. January moved to 8.7% from 6%, offsetting the February loss. Industrial Production dropped 2.2% in February, far more than the 0.6% forecast. January was revised to 1.1% from 0.9%. Capacity Utilization fell to 73.8% from 75.5% missing the 75.8% forecast. The Import Price Index in February rose 1.3% (MoM) and 3% (YoY) after 1.4% and 1% in January. The Export Price Index rose 1.6% (MoM) and 5.2% (YoY) in February following 2.5% and 2.3% in January. Business Inventories added 0.3% in January as expected, December was revised to 0.8% from 0.6%.
Wednesday
Housing Starts fell 10.3% in February to 1.421 million (annualized). Building Permits dropped 10.8% to 1.682 million (annualized). The Fed policy committee left the fed funds rate at its 0.25% upper target and the bond purchase program at $120 billion a month, 2/3 in Treasuries and the balance in mortgage-backed securities.
Thursday
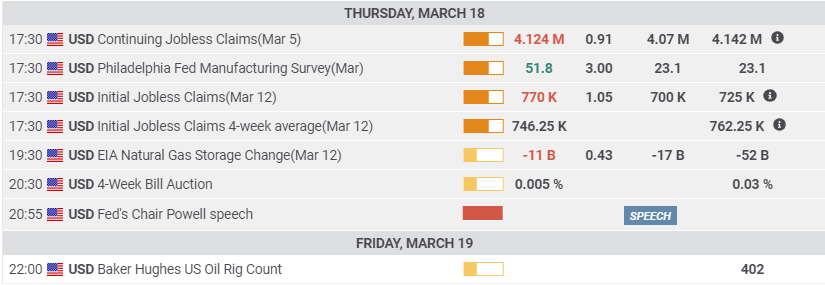
Initial Jobless Claims in the March 12 week rose to 770,000 from 725,000. The forecast was 700,000. Continuing Claims rose to 4.124 million in the March 5 week from 4.142 million; 4.07 million was forecast.
FXStreet
Japan statistics March 22-March 26
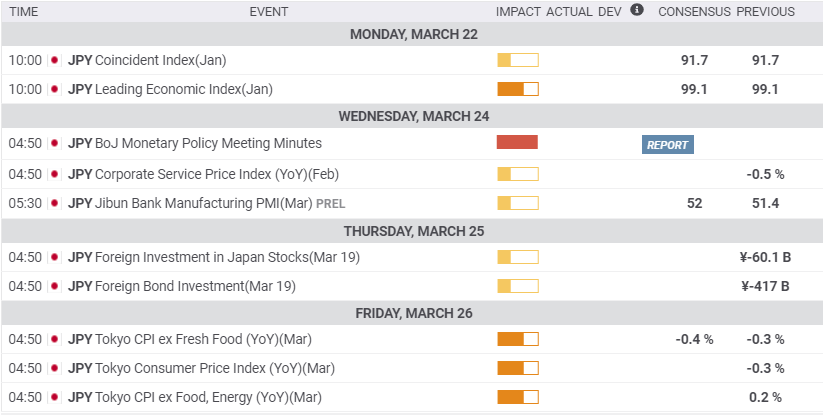
Tokyo CPI for March will indicate if deflation is loosening its grip on the Japanese economy but it will not move currency markets.
Monday
The Coincident Index and the Leading Economic Index for January are forecast to be unchanged upon revision at 91.7 and 99.1 respectively.
Wednesday
The Jibun Bank Manufacturing PMI for March is expected to be 52 after 51.4 in February, which was the highest score since December 2019.
Friday
Tokyo CPI (YoY) for March is due: February -0.3%, ex Food & Energy 0.2%, ex Fresh Food expected -0.4%, February -0.3%.
FXStreet
US statistics March 22-March 26
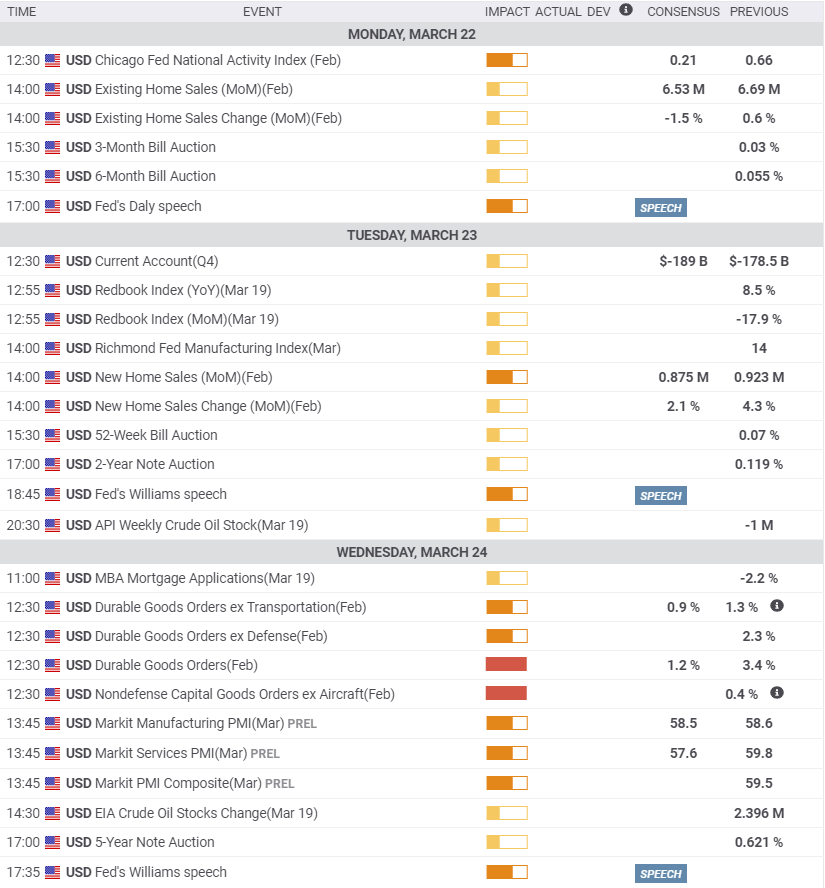
Existing Home Sales and Durable Goods for February carry the most information about the state of the US economy but neither will impact markets.
Monday
Existing Home Sales, 90% of the US market, are expected to dip 1.5% to 6.53 million (annualized) in February from 6.69 million.
Tuesday
New Home Sales in February should fall 5.2% to 875,000 annually from 923,000.
Wednesday
Durable Goods Orders for February are expected to rise 1.2% after the 3.4% gain in January. Orders ex Transportation should increase 0.9% following the revised 1.3% in January. Nondefense Capital Goods, the business investment category, added 0.4% in January.
Thursday
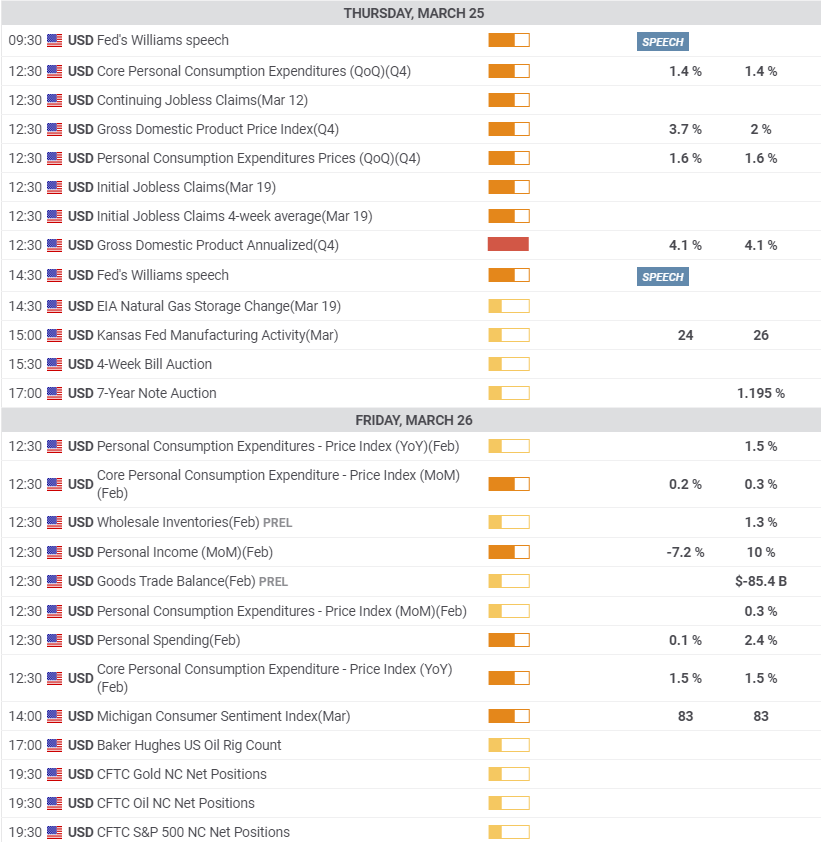
Initial Jobless Claims for the March 19 week: 770,000 prior. Continuing Claims for the March 12 week: prior 4.124 million. Fourth quarter GDP is expected to be unchanged at 4.1%.
Friday
Personal income is projected to fall 7.2% in February after rising 10% in January. Personal Spending is predicted to rise 0.1% following January's 2.4% increase. The Core Personal Consumption Price Index (PCE) is predicted to rise 0.2% (MoM) in February from 0.3% previous and to be unchanged at 1.5% on the year.
FXStreet
USD/JPY technical outlook
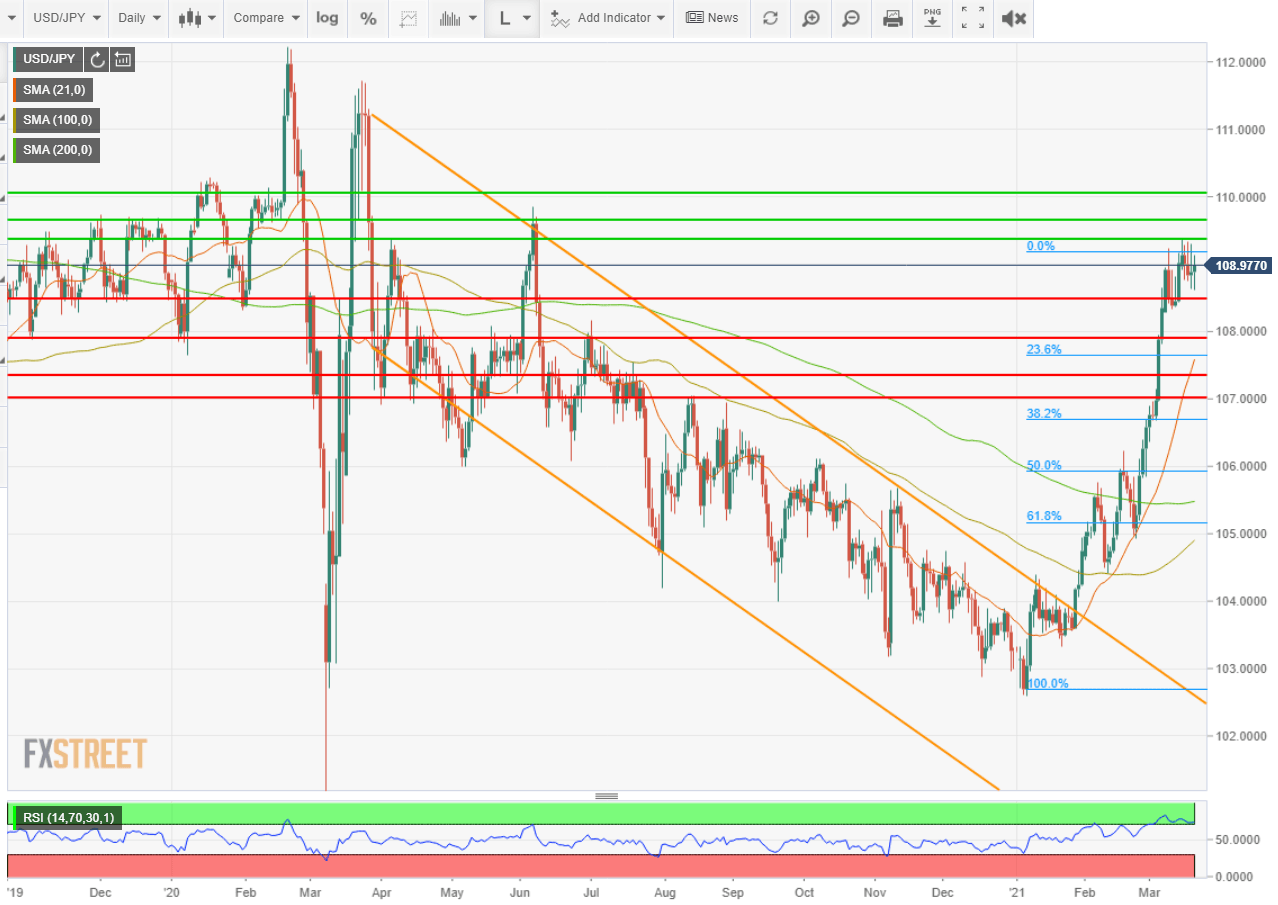
The consolidation in the USD/JPY over the past two weeks has given a firm base at 108.50.The rapidity of the ascent has as yet provided no pull-back and little profit-taking.
With the US Federal Reserve apparently happy or at least tolerant of rising Treasury and commercial yields and the BOJ quietly pleased, the direction of the USD/JPY is higher. Nonetheless, even under this fundamental impetus, the longer the pair lingers without new highs, the greater the temptation for traders to book some of those gains. Any declines would be temporary and limited by support, including the 23.6% Fibonacci at 107.64. The USD/JPY ranged above 110.00 for much of 2018 and 2019 so there is no fundamental reason that if US rates continue to rise, it could not return to those levels.
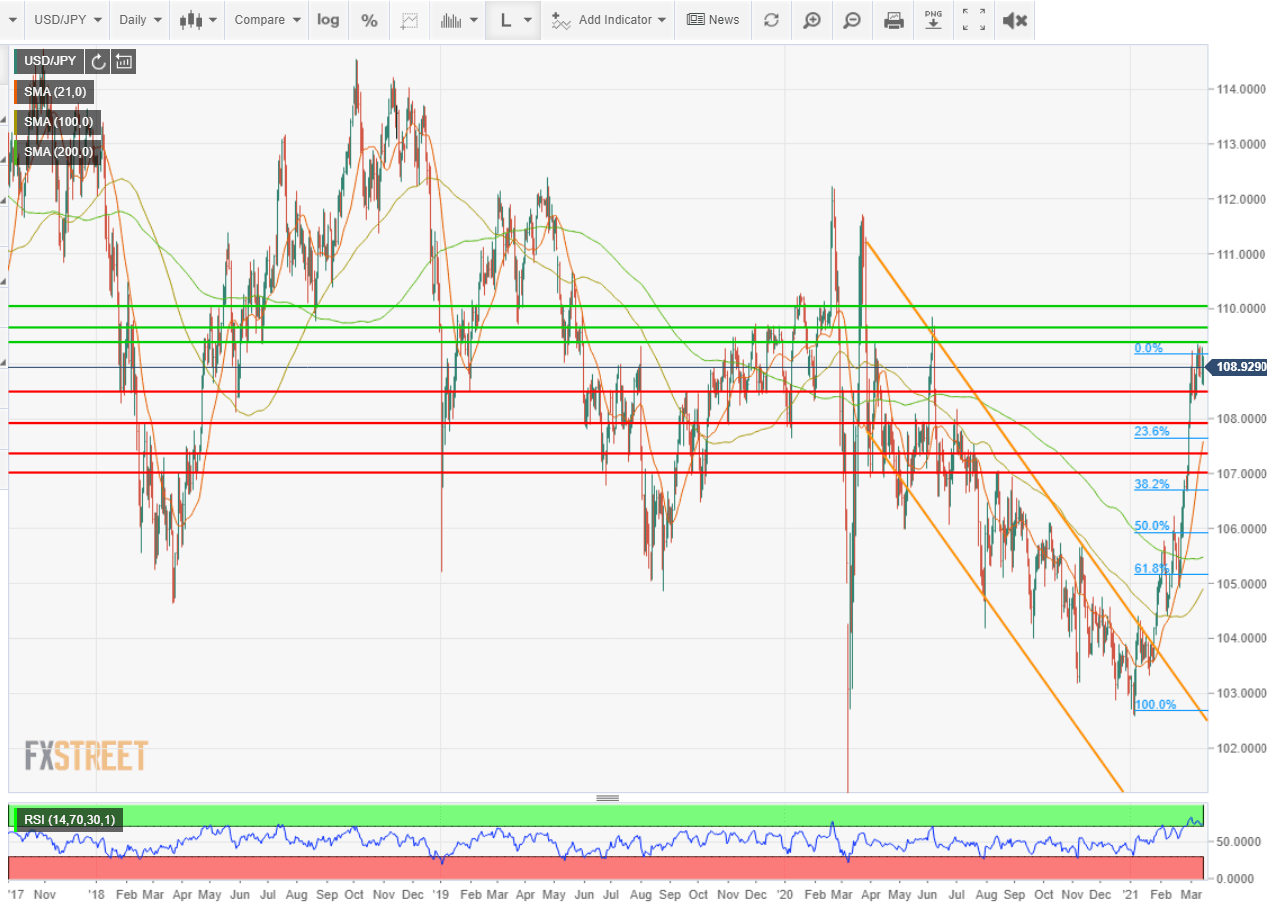
The Relative Strength Index at 73.68 is slightly overbought and adds weight to a profit decline but is not in itself a sell signal. The 21-day moving average (MA) at 107.59 seconds the Fibonacci support at 107.64. The 100-day MA at 104.90 and the 200-day MAt 105.48 are out of the current technical picture.
Resistance: 109.35, 109.65, 110.00
Support: 108.50, 107.90, 107.35, 107.00
FXStreet Forecast Poll
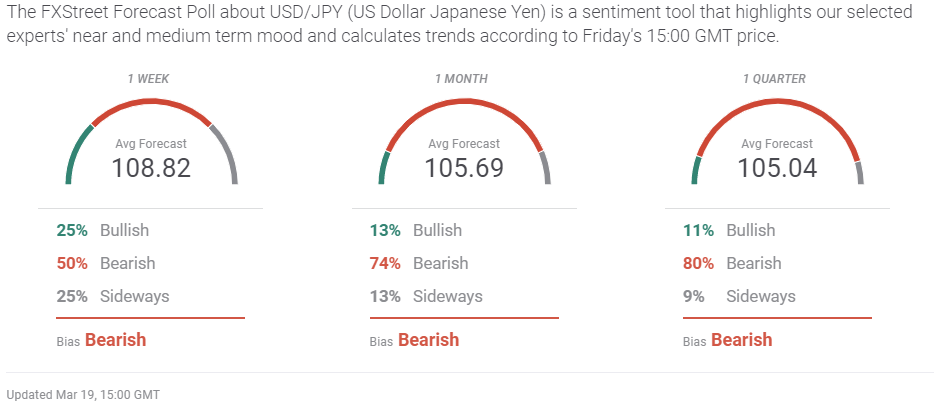
This week's FXStreet Forecast Poll takes a strictly technical view of the USD/JPY. Given the very rapid ascent of the pair this year, technically inspired profit-taking is a standard assumption. Whether or not this takes place depends on US yields. If American Treasury rates continue to rise they will pull the USD/JPY higher. If not, let the profit-booking begin.
Premium
You have reached your limit of 3 free articles for this month.
Start your subscription and get access to all our original articles.
Author

Joseph Trevisani
FXStreet
Joseph Trevisani began his thirty-year career in the financial markets at Credit Suisse in New York and Singapore where he worked for 12 years as an interbank currency trader and trading desk manager.