USD/JPY Forecast: Eyes 101.19 - starting point of Trump rally

The USD/JPY pair dipped below the major support level of 105.00 in Asia, opening doors for a sell-off all the way down to 101.19 - November 2016 low (starting point of Trump rally).
Weekly chart
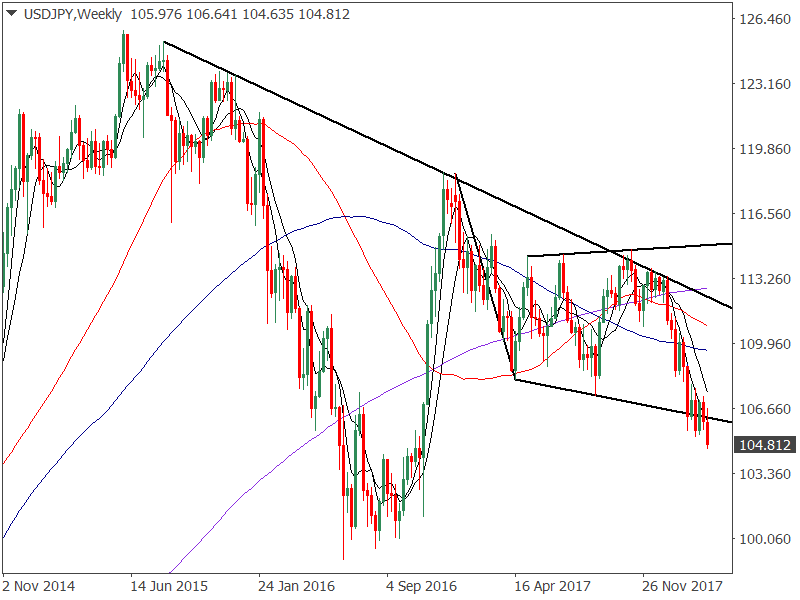
Having failed to beat the long-term descending trendline resistance in Q4, 2017, the pair breached the inverted flag/bear flag-like pattern in mid-Feb. In the subsequent weeks, bulls tried to regain control, occasionally pushing the spot above 107.00. However, trade war fears and the turmoil in Washington kept the bears (JPY bulls ) in the game.
The drop to 104.63 (the lowest level since November 2016) seen today signals a convincing downside break of the bear flag (bearish continuation pattern), meaning the sell-off from the January 2017 high of 118.61 has resumed and the spot could drop to 95.70 - target as per the measured height method. The target may be somewhat far fetched, but one thing is quite clear - the bear grip has strengthened and the spot will likely drop to 101.19 in the next few weeks.
On the higher side, 106.20 - (channel support will not act as a stiff resistance) is the level to watch out for. Only a convincing move above the said level would abort the bearish view. That said, the odds of a big rally will likely remain low as long as the 5-week moving average (MA) and the 10-week MA is trending lower in favor of the bears.
Author

Omkar Godbole
FXStreet Contributor
Omkar Godbole, editor and analyst, joined FXStreet after four years as a research analyst at several Indian brokerage companies.


