USD/JPY Forecast: Bearish extension around the corner
USD/JPY Current price: 110.87
View Live Chart for the USD/JPY
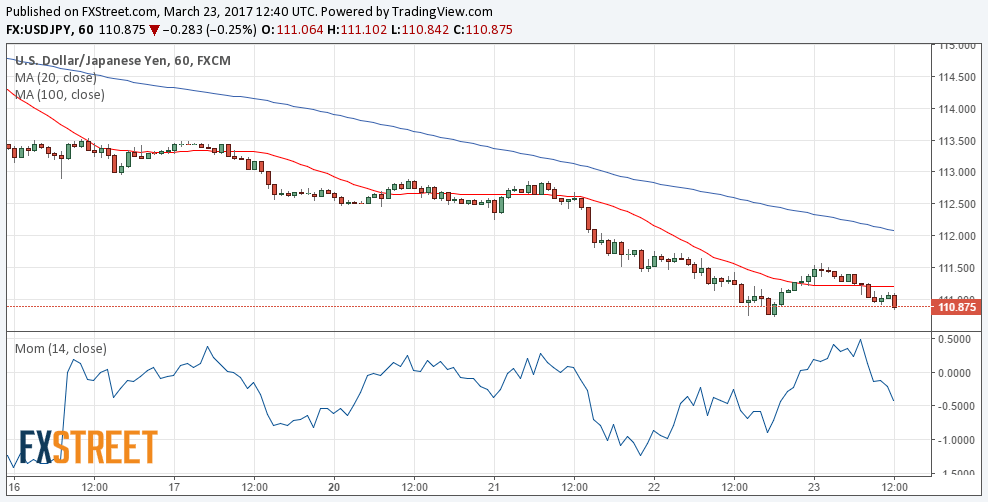
Bearish extension around the corner. The USD/JPY pair corrected higher early Asia, but met selling interest around 111.60, a former strong support, resuming its decline and now trading not far from the year low set this Wednesday at 110.72. Worse-than-expected US data, as weekly unemployment claims surprised to the upside, printing 258K against 240K expected for the week ended March 17th, fueled the pair's decline. Asian shares closed modestly higher, while in Europe, most equities trade in the green, although the pair keeps falling, indicating that traders have made up their minds and decided that is better to go long in the JPY, maintaining the risk towards the downside and exposing the 110.00 level. Short term, the 1 hour chart shows that the price is far below its moving averages, with the 100 SMA now approaching a major Fibonacci resistance at 112.00. Technical indicators in the mentioned time frame head strongly lower near oversold territory supporting some further slides. In the 4 hours chart, technical indicators accelerated their slides within oversold territory, reaffirming the shorter term outlook.
Support levels: 110.70 110.40 109.90
Resistance levels: 111.10 111.60 112.00
Interested in USD/JPY technicals? Check out the key levels
Author

Valeria Bednarik
FXStreet
Valeria Bednarik was born and lives in Buenos Aires, Argentina. Her passion for math and numbers pushed her into studying economics in her younger years.


