USD/JPY Forecast: At fresh 2017 lows

USD/JPY Current price: 111.37
View Live Chart for the USD/JPY
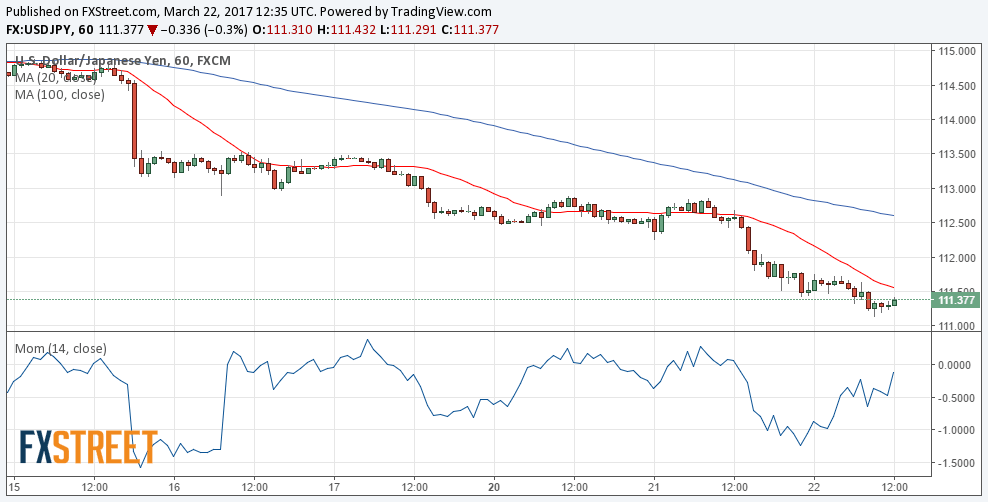
At fresh 2017 lows. The USD/JPY plunged to 111.13, its lowest for this year, following the sharp decline in Wall Street seen this Tuesday, as Asian shares followed suit, with the Nikkei shedding over 400 points and the Hang Seng down around 270. Yen's rally pared after the release of local data and BOJ's Minutes, this last, showing that policymakers acknowledged that prices remain far below the bank's objectives. February´s trade balance showed a surplus of ¥813.3B, with exports rising by 11.3%, but imports down to 1.2% from previous 8.5%. In the 1 hour chart, the price remains well below bearish moving averages and near its daily low, while the RSI indicator consolidates around 31 and the Momentum indicator corrects higher within negative territory, all of which maintains the risk towards the downside. In the 4 hours chart, the bearish momentum is clearer, given that technical indicators maintain their bearish slopes, despite being in oversold territory. As long as the price remains below 111.60, chances of an upward move will be well-limited, while a break below the daily low exposes the pair to a continued decline towards 110.00.
Support levels: 111.10 110.75 110.40
Resistance levels: 111.60 112.00 112.45
Interested in USD/JPY technicals? Check out the key levels
Author

Valeria Bednarik
FXStreet
Valeria Bednarik was born and lives in Buenos Aires, Argentina. Her passion for math and numbers pushed her into studying economics in her younger years.


