USD/JPY analysis: uncertainty underpins safe-haven yen

USD/JPY Current price: 112.89
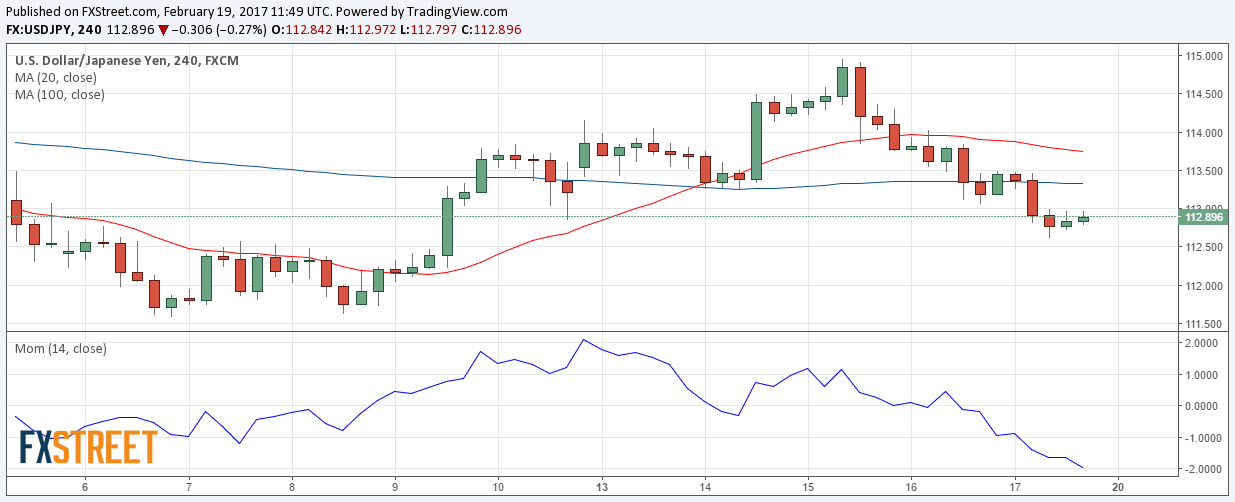
The USD/JPY pair trimmed all of its previous week gains after a failed attempt to surge beyond 115.00, resuming the bearish trend that began with the year. The pair topped at 114.95 last Wednesday, when a hawkish FED's Yellen opened doors for a rate hike in March. And while US stocks surged to record highs, US yields were unable to hold on to gains, and finished the week near February lows. Also, supporting the yen is the ongoing political uncertainty in Europe and the US that at the end of the day pushes speculative interest into safe-haven assets. From a technical point of view, the daily chart shows that the pair is holding a few pips above its 100 DMA currently around 112.45, while a major Fibonacci support comes at 111.95. In the same chart, technical indicators have turned south around their mid-lines, but lack enough downward momentum to confirm a bearish extension. In the shorter term, and according to the 4 hours chart, the bearish bias is firmer, as indicators maintain their sharp bearish slopes within negative territory, whilst the price has settled below bearish 100 and 200 SMAs, with the shortest acting as dynamic resistance around 113.40.
Support levels: 112.45 112.10 111.60
Resistance levels: 113.00 113.40 113.85
Author

Valeria Bednarik
FXStreet
Valeria Bednarik was born and lives in Buenos Aires, Argentina. Her passion for math and numbers pushed her into studying economics in her younger years.


