USD/JPY analysis: risk remains towards the downside

USD/JPY Current price: 111.36
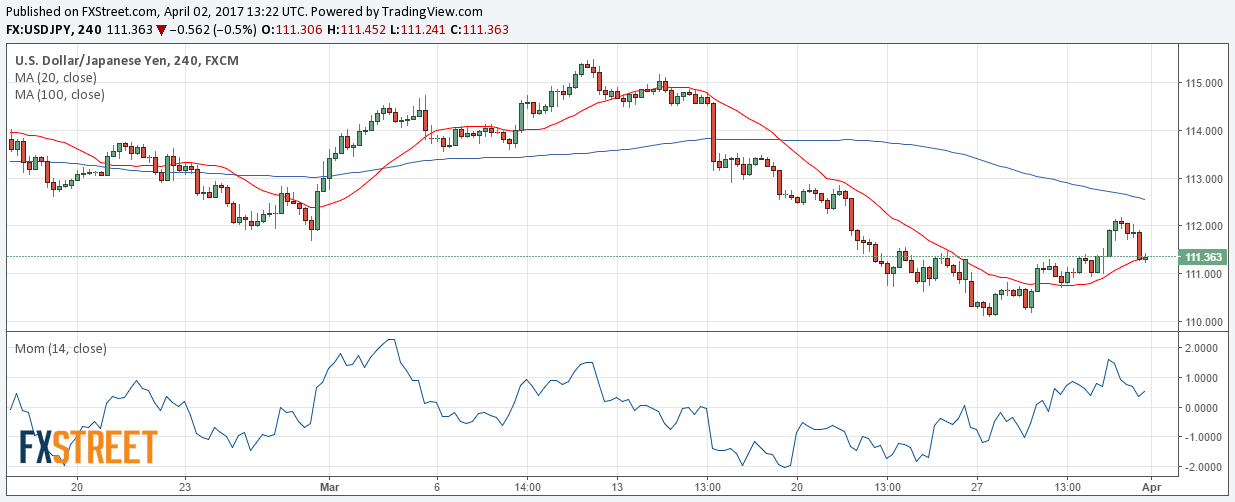
The USD/JPY pair advanced up to 112.19 early Friday, its highest for the week, but closed the day in the red around 111.36 as the positive momentum faded on mute yields. The advance, was triggered by better-than-expected Japanese inflation figures that picked up in February, whilst the unemployment rate fell to a two-decade low. Core yearly inflation surged for a second consecutive month up by 0.2% still far away from the BOJ's 2% target, but at least out of negative territory. The poor performance of equities and yields, however, pushed the pair into the red during the last two sessions of the week. The daily chart shows that, despite closing with gains, the pair set a lower low and a lower high, indicating that the bearish dominant trend remains firm in place in the longer run. Daily basis, the pair is trading between the 100 and 200 SMAs, with the shortest capping the upside around 114.40, and the longest providing support at 109.20. Technical indicators in the mentioned chart diverge from each other, with the Momentum recovering and the RSI heading south, both within negative territory. Shorter term, the 4 hours chart shows that the 100 and 200 SMAs keep heading south above the current level, whilst technical indicators have turned flat within neutral territory. Renewed selling pressure below 111.00, will likely favor additional declines towards the 110.10 level, last week low.
Support levels: 110.95 110.50 110.10
Resistance levels: 111.60 112.00 112.50
Author

Valeria Bednarik
FXStreet
Valeria Bednarik was born and lives in Buenos Aires, Argentina. Her passion for math and numbers pushed her into studying economics in her younger years.


