|

USD/JPY analysis: risk aversion pushes it below 111.00

USD/JPY Current price: 110.79

  • Equities and yields lower amid soft US data, uncertainty about US and China trade developments.
  • Japanese preliminary Leading Index for July foreseen at 103.6, below previous 104.7.

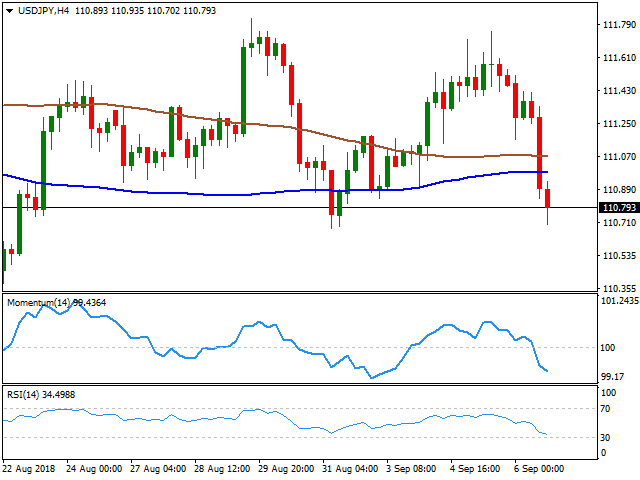
The USD/JPY pair fell to a fresh September low of 110.70 as sentiment took at a turn to the worse with equities falling worldwide and US Treasury yields also fell on the back of weaker-than-expected US employment data. Mounting concerns on upcoming tariffs from the US to Chinese goods weighed on investors. As for US yields, the yield on the benchmark 10-year Treasury note slipped to 2.87%. Japan will release during the upcoming Asian session the preliminary Leading Economic Index and Coincident Index, both for July. Yen's crosses, however, could enter wait-and-see mode ahead of the US Nonfarm Payroll report to be out later on Friday. The pair has turned bearish in the short-term, as in the 4 hours chart, it is trading below its 100 and 200 SMA, which continue lacking directional strength, running parallel around the 111.00 figure, while technical indicators maintain strong downward slopes, nearing oversold readings. Last week low at 110.68 is the immediate support, with a clear break below it on a disappointing US employment report favoring a downward extension to 109.80.

Support levels: 110.65 110.25 109.80

Resistance levels: 111.10 111.45 111.80

View Live Chart for the USD/JPY

Author

Valeria Bednarik

Valeria Bednarik was born and lives in Buenos Aires, Argentina. Her passion for math and numbers pushed her into studying economics in her younger years.

More from Valeria Bednarik
Share:

Editor's Picks

EUR/USD: Cautiously optimistic near 1.1550 ahead of the ECB

EUR/USD extends its weekly recovery for the third day in a row on Wednesday, navigating in a sidelined fashion around 1.1550 on the back of humble losses in the US Dollar. In the meantime, market participants continue to closely follow developments in the Middle East while slowly gearing up for the ECB gathering on Thursday.

GBP/USD recedes from tops, hovers around 1.3400

GBP/USD could not sustain the initial bull run and is now slipping back toward the 1.3400 neighbourhood on Wednesday. Cable’s continuation of the ongoing leg higher follows mild selling pressure on the Greenback, despite steady uncertainty on the geopolitical front and elevated US inflation.

Gold bleeding continues as Middle East crisis escalates, Fed hike coming

Gold is accelerating its downward trends and approaches the area of $4,100 per troy ounce on Wednesday, where the 2026 bottom sits so far. The persistent decline in the precious metal almost exclusively follows the swelling opinion that the Fed will keep a cautious stance in H2, a view that was reinforced following earlier US CPI data.

Ethereum: Network activity remains elevated despite recent declines
Ethereum Active Addresses have maintained a downtrend since declining from peak levels in early February. The 14-day moving average of the metric shows that unique on-chain participation has been contracting MoM since the sharp decline in February.
From sizzle to fizzle: Tech sinks as Oil puts the Fed tail back on the table
Wall Street was not hit by one punch. It was caught between three swinging doors at the same time: a renewed technology unwind, a fresh geopolitical oil bid, and a wave of equity supply that is starting to look less like capital formation and more like a liquidity test for the entire AI complex.
The US economy defies the rules: 100 days into the Oil shock and the recession signal is still missing

More than three months after the start of the Iran war and the resulting disruption to global energy markets, the US economy continues to display remarkable resilience. The conflict has triggered a sharp rise in Oil prices, reignited inflationary pressures and fueled widespread concerns about a potential economic slowdown.