USD/CHF Elliott Wave technical analysis [Video]
![USD/CHF Elliott Wave technical analysis [Video]](https://editorial.fxsstatic.com/images/i/USDCHF-bearish-object.png)
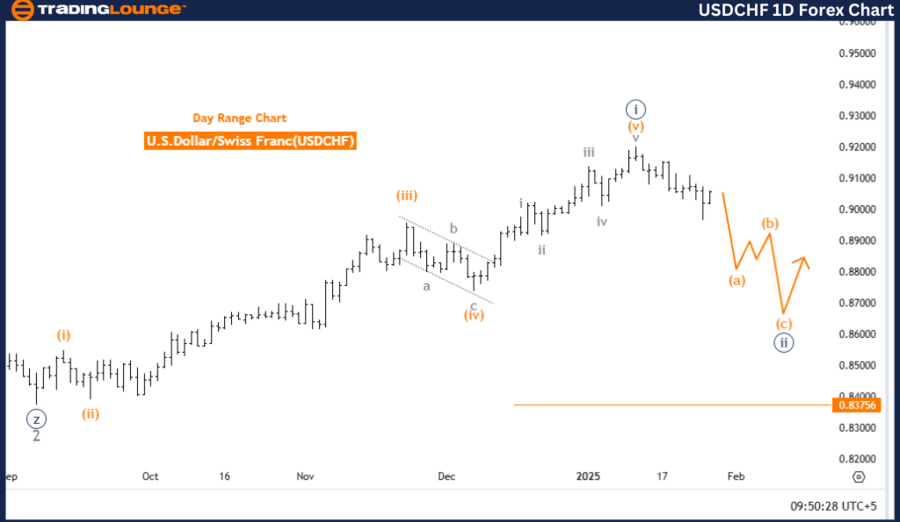
USDCHF Elliott Wave Analysis – Trading Lounge.
U.S. Dollar / Swiss Franc (USDCHF) – Day chart.
USD/CHF Elliott Wave technical analysis
-
Function: Counter Trend.
-
Mode: Corrective.
-
Structure: Orange Wave A.
-
Position: Navy Blue Wave 2.
-
Next higher degree direction: Orange Wave B.
-
Details: Navy Blue Wave 1 appears to be complete, with Orange Wave A of 2 currently in progress.
-
Wave cancel invalidation level: 0.83756.
Analysis overview
This analysis evaluates the USDCHF currency pair using Elliott Wave Theory on a daily chart. It emphasizes a counter-trend movement in corrective mode. The focus is on Orange Wave A, following the apparent completion of Navy Blue Wave 1.
The market is currently in Navy Blue Wave 2, representing a temporary pullback within the broader structure. This phase consolidates gains achieved during Navy Blue Wave 1. Once Orange Wave A concludes, Orange Wave B is anticipated as the next higher-degree corrective wave.
The invalidation level for the current wave structure is 0.83756. A price drop below this level invalidates the wave count and necessitates a reassessment of the market outlook and current analysis.
Summary
The daily chart analysis for USDCHF identifies a corrective phase, defined by Orange Wave A within Navy Blue Wave 2. The completion of Navy Blue Wave 1 marks the transition into this temporary pullback phase. The expected emergence of Orange Wave B suggests that the corrective trend will continue before a potential return to bullish momentum.
The invalidation level serves as a critical benchmark for managing risk and confirming the wave count. This structured analysis provides insights into the market’s counter-trend movements, helping traders monitor corrective developments and prepare for potential market shifts within the Elliott Wave framework.
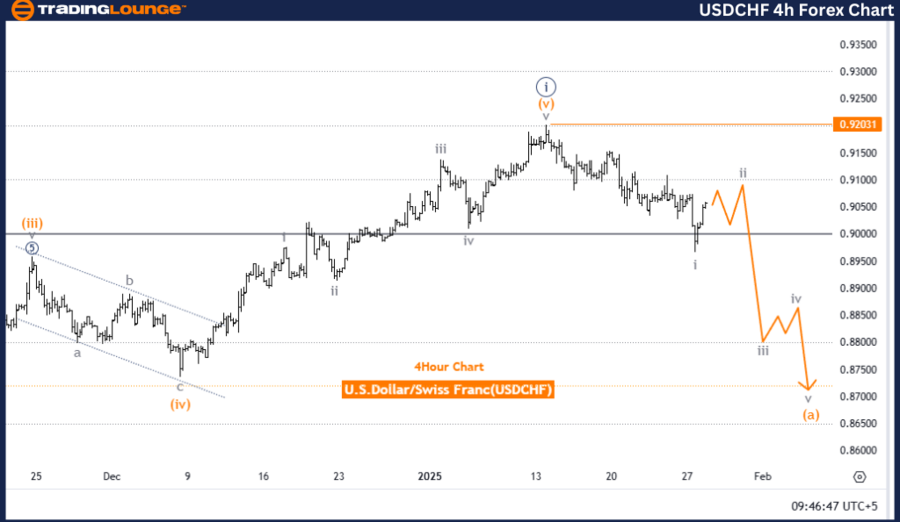
USD/CHF – Four-hour chart.
USD/CHF Elliott Wave technical analysis
-
Function: Counter Trend.
-
Mode: Corrective.
-
Structure: Gray Wave 2.
-
Position: Orange Wave A.
-
Next lower degree direction: Gray Wave 3.
-
Details: Gray Wave 1 appears complete, and Gray Wave 2 is currently in progress.
-
Wave cancel invalidation level: 0.92031.
Analysis overview
This analysis examines the USDCHF currency pair using Elliott Wave Theory on a 4-hour chart, highlighting a counter-trend movement in corrective mode. The key structure being observed is Gray Wave 2, which began following the completion of Gray Wave 1, signaling a temporary corrective phase.
The pair is now within Orange Wave A, which represents the initial stage of Gray Wave 2. This phase reflects a pullback in the market, consolidating the gains made during Gray Wave 1. Once Gray Wave 2 concludes, Gray Wave 3 is expected to develop, potentially resuming the higher-degree trend with renewed bullish momentum.
The invalidation level for the current wave count is set at 0.92031. A decline below this level would invalidate the wave structure and necessitate a reevaluation of the market outlook.
Summary
The 4-hour chart analysis for USDCHF outlines a counter-trend corrective phase led by Gray Wave 2. Following the completion of Gray Wave 1, the active position in Orange Wave A suggests a temporary pullback. The anticipated development of Gray Wave 3 hints at the resumption of upward momentum.
The invalidation level serves as a crucial reference for managing risk and validating the wave count. This structured analysis provides traders with actionable insights into the ongoing corrective movement and helps them prepare for the next potential impulsive phase within the Elliott Wave framework.
USD/CHF Elliott Wave technical analysis [Video]
Author

Peter Mathers
TradingLounge
Peter Mathers started actively trading in 1982. He began his career at Hoei and Shoin, a Japanese futures trading company.


