USD/CHF Elliott Wave technical analysis [Video]
![USD/CHF Elliott Wave technical analysis [Video]](https://editorial.fxstreet.com/images/Markets/Currencies/Majors/USDCHF/coins-and-notes-from-switzerland-17730378_XtraLarge.jpg)
USD/CHF Elliott Wave technical analysis
Function: Trend.
Mode: Impulsive.
Structure: Blue wave 1.
Position: Black wave 3.
Direction next lower degrees: Blue wave 1 (started).
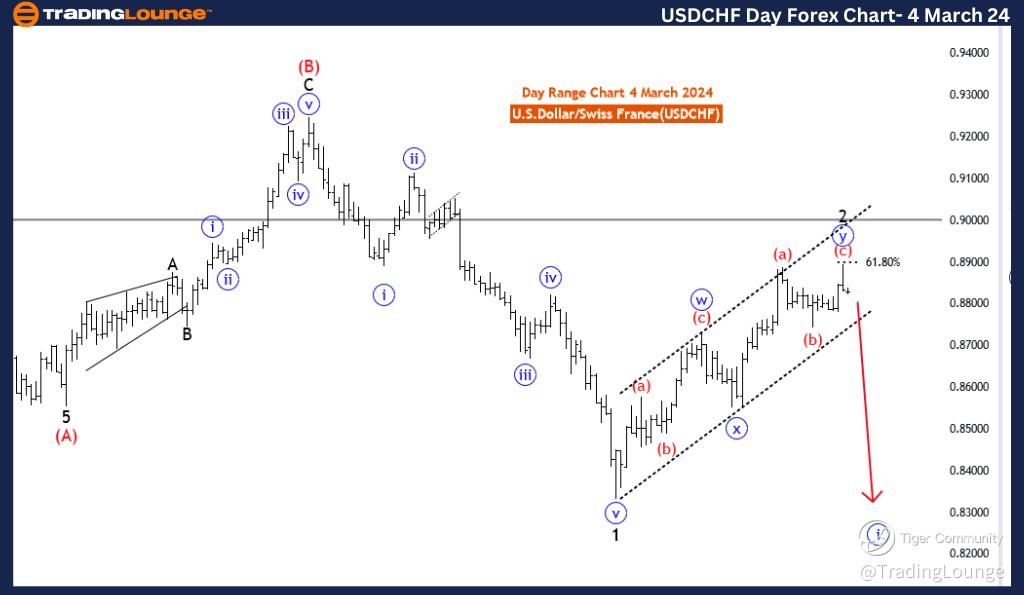
Details: blue wave Y of 2 looking completed at 0.88958 . Now blue wave 1 of 3 is in play. Wave Cancel invalid level: 0.88958.
The "USD/CHF Elliott Wave Analysis Trading Lounge Day Chart" dated 1 March 24, provides an in-depth examination of the U.S. Dollar/Swiss Franc (USD/CHF) currency pair using Elliott Wave analysis. The analysis, conducted on the daily chart, is geared towards understanding the prevailing trend dynamics and forecasting potential future movements within the broader wave structure.
The identified "FUNCTION" is "Trend," indicating that the analysis is primarily concerned with identifying and navigating the existing trend in the USD/CHF pair. The focus is on capturing the directional movement of prices over a more extended period.
The specified "MODE" is "Impulsive," suggesting that the current market conditions are characterized by forceful and decisive price movements aligned with the overall trend. This implies that the USD/CHF pair is exhibiting strong directional momentum.
The described "STRUCTURE" is "Blue wave 1," representing a specific phase within the Elliott Wave pattern. The analysis emphasizes the development and progression of blue wave 1, indicating a significant upward movement within the broader wave structure.
The identified "POSITION" is "Black wave 3," signifying the current placement within the larger Elliott Wave pattern. Black wave 3 represents a higher-degree wave, suggesting a powerful phase in the upward trend of the USD/CHF pair.
Regarding "DIRECTION NEXT LOWER DEGREES," the emphasis is on "Blue wave 1 (started)." This highlights the initiation of the next phase within the Elliott Wave pattern, indicating the continuation of the upward trend.
The "DETAILS" section notes that "blue wave Y of 2 looking completed at 0.88958." This signifies the completion of a specific subwave within the Elliott Wave pattern. It further states that "blue wave 1 of 3 is in play," indicating the continuation of the upward trend and the start of the next higher-degree wave.
The "Wave Cancel invalid level" is set at 0.88958, serving as a crucial reference point. A breach beyond this level would invalidate the current wave count, necessitating a reassessment of the analysis.
In summary, the USD/CHF Elliott Wave Analysis for the daily chart on 1 March 24, underscores a focus on the impulsive and trending nature of the market. The analysis anticipates the continuation of the upward trend, with specific attention to the completion of sub waves and the initiation of the next higher-degree wave. The Wave Cancel invalid level at 0.88958 serves as a critical marker for potential shifts in the wave count and trend dynamics.
USD/CHF day chart
USD/CHF Elliott Wave technical analysis
Function: Trend.
Mode: Impulsive.
Structure: Blue wave 1.
Position: Black wave 3.
Direction next lower degrees: Blue wave1 (started).
Details: Blue wave Y of 2 looking completed at 0.88958 . Now blue wave 1 of 3 is in play . Wave Cancel invalid level: 0.88958.
The "USD/CHF Elliott Wave Analysis Trading Lounge 4 Hour Chart" dated 1 March 24, presents a detailed technical analysis of the U.S. Dollar/Swiss Franc (USD/CHF) currency pair using Elliott Wave principles. The analysis primarily focuses on the 4-hour chart, emphasizing the current phase and potential future movements within the broader structure.
The identified "FUNCTION" is "Trend," indicating that the analysis is oriented towards capturing and understanding the prevailing direction of the market. In this case, the emphasis is on recognizing and navigating the existing trend in the USD/CHF pair.
The specified "MODE" is "Impulsive," suggesting that the current market conditions are characterized by strong and decisive price movements in the direction of the trend. This aligns with the overall trend function identified in the analysis.
The described "STRUCTURE" is "Blue wave 1," which represents a specific phase within the Elliott Wave pattern. The analysis focuses on the development and progression of blue wave 1 as part of the broader wave structure.
The identified "POSITION" is "Black wave 3," indicating the current placement within the larger Elliott Wave pattern. Black wave 3 signifies a higher-degree wave within the overall structure, suggesting a significant and powerful phase in the upward trend.
Regarding "DIRECTION NEXT LOWER DEGREES," the emphasis is on "Blue wave 1 (started)." This highlights the initiation of the next phase within the Elliott Wave pattern, reinforcing the impulsive nature of the current trend.
The "DETAILS" section notes that "blue wave Y of 2 looking completed at 0.88958." This signifies the completion of a specific subwave within the Elliott Wave pattern, and it states that "blue wave 1 of 3 is in play," indicating the continuation of the upward trend.
The "Wave Cancel invalid level" is set at 0.88958, serving as a crucial reference point. A breach beyond this level would invalidate the current wave count, prompting a reevaluation of the analysis.
In summary, the USD/CHF Elliott Wave Analysis for the 4-hour chart on 1 March 24, underscores a focus on the impulsive and trending nature of the market. The analysis anticipates the continuation of the upward trend, with specific attention to the completion of sub waves and the initiation of the next higher-degree wave. The Wave Cancel invalid level at 0.88958 serves as a critical marker for potential shifts in the wave count and trend dynamics.
USD/CHF four hour chart
-638451305229310539.png)
USD/CHF Elliott Wave technical analysis [Video]
Author

Peter Mathers
TradingLounge
Peter Mathers started actively trading in 1982. He began his career at Hoei and Shoin, a Japanese futures trading company.


