US Services Purchasing Managers' Index Preview: Shutdown, what shutdown?
-
US service sector expected to cool in January, economic and political cross-currents make predications difficult
-
Non-farm payrolls were unaffected by the partial government shutdown
-
Factory PMI indexes rebounded in January

The Institute for Supply Management will release its non-manufacturing Purchasing Managers' Index for January at 10:00 am EST, 15:00 GMT February 5th.
Forecast
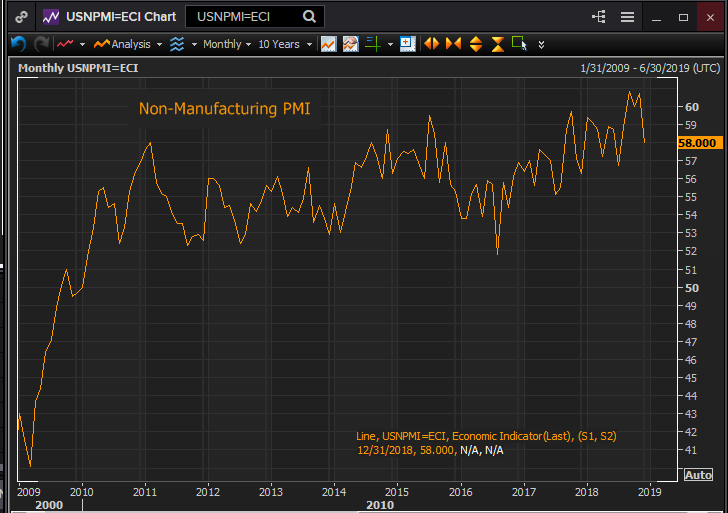
The non-manufacturing purchasing manager's index from the Institute for Supply Management is expected to decline to 57.2 in January from 58.0 in December. It hit a 13 year high in September at 60.8 and then 60.7 in November. The Business Activity Index is also predicted to decrease to 59.5 from December's 61.2. Both gauges were revised higher in December: the PMI Index to 58.0 from 57.6 and the Businesses Activity to 61.2 from 59.9.
Reuters
Economics of the partial Federal Government shutdown
The much reported economic and business impact from the 35 day shutdown of one-quarter of the federal government has so far, had little or no substantive on the US economy.
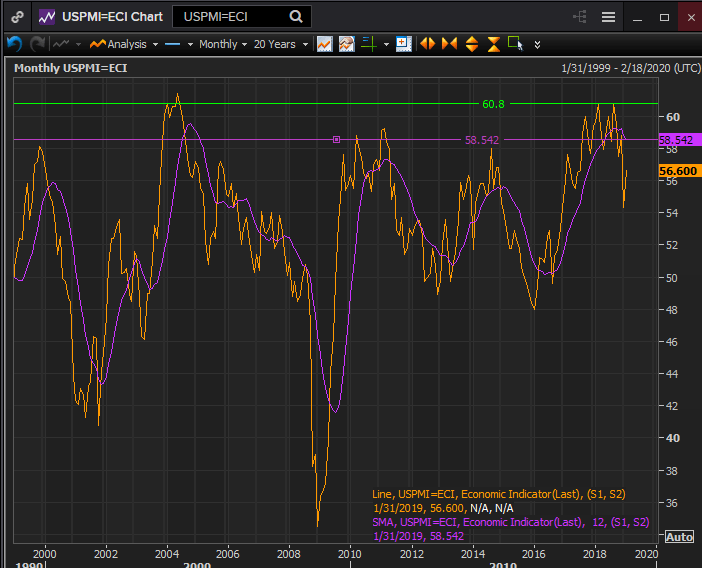
The manufacturing PMI index, the factory version of the above came in for January at 56.6 well above the 54.2 estimate and December’s 54.3 score. This reversed a five month drop from August’s 14 year high of 60.8. Even with the second half decline the 12-month moving average in January is above every score from January 2005 to April 2018. Most instructively the new order index a gauge of future business was sharply higher in January jumping to 58.2 from 51.3 and well in front of the 51.1 consensus estimate.
ISM Manufacturing PMI
Reuters
The interesting feature of the manufacturing survey is that the most recent peaks in the PMI and new orders indexes came in August, the bottom in December and the rebound in January at the height of the government shutdown. Manufacturing is clearly operating independently of Washington politics.
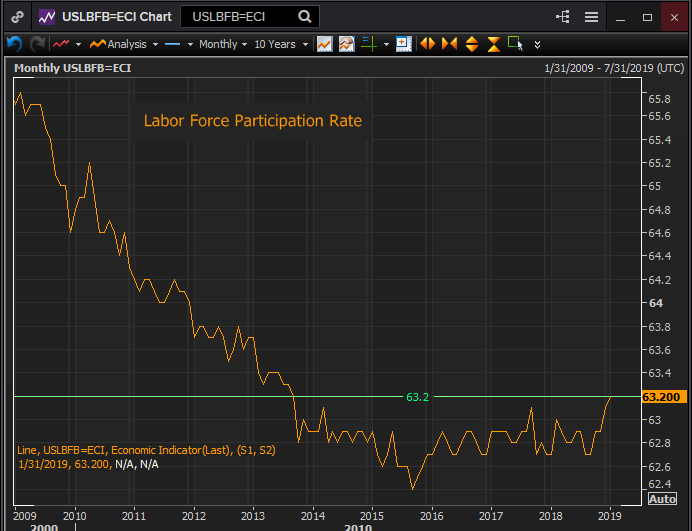
Non-farm payrolls show an equal imperviousness to the supposed effects of the shutdown. Total payrolls soared 304,000 in January almost double the 165,000 median forecast. Private employers added 296,000 workers, manufacturing employment rose 13,000 and wages increased 3.2% on the year. The labor force participation rate reached 63.2% the highest it has been in five years as large numbers of folks joined those working or looking for work.
Reuters
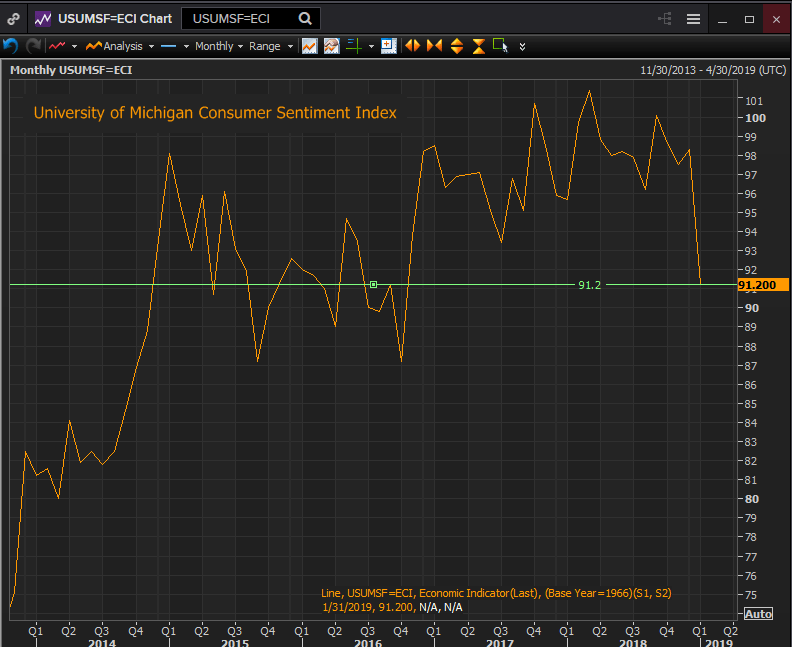
Consumer sentiment is the one area that seems to show a notable drag from the optics of the government shutdown.
The University of Michigan Consumer Sentiment Index dropped from 98.3 in December to 91.2 in January bringing it back to levels of just before the November 2016 election. The current conditions index fell to 108.8 in January from 116.1 in December and the expectation index fell from 87.0 to 79.9.
Reuters
Almost all of the direct measures of the consumer environment, employment, wages, ease of finding work and jobless claims show a vigorous and improving labor market. The fall in consumer sentiment is not because of a change in the availability of jobs market or a contraction wages. It is certainly possible that consumer outlook was affected by the nonstop coverage of the shutdown. What will be more telling is the December retail figures due out sometime in the next week.
Purchasing managers in the service sector see the same conditions as their colleagues on the factory side. As the late year decline in the service indexes matches several of those from the manufacturing sector it is likely the rebound on the goods producing side will be reproduced in services.
Author

Joseph Trevisani
FXStreet
Joseph Trevisani began his thirty-year career in the financial markets at Credit Suisse in New York and Singapore where he worked for 12 years as an interbank currency trader and trading desk manager.


