US, EMU and UK March manufacturing PMIs stronger than forecast, Services collapse
- US Manufacturing PMI 49.2 in March, 42.8 expected.
- US Services PMI 39.1, consensus prediction 42, February 49.4.
- Euro zone and UK composite PMIs plunge the most on record.
- Delivery times may have distorted manufacturing numbers says IHS.

Sentiment in the US manufacturing sector and in the Euro zone was more resilient than anticipated in March but IHS Markit, the survey firm, said this might be due to a statistical distortion.
US PMI
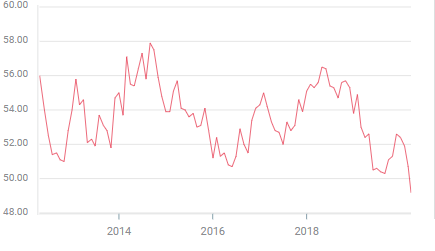
The US purchasing managers’ index in manufacturing from IHS Markit registered 49.2 this month, down from 50.7 in February but well in front of the 42.8 consensus forecast.
IHS Markit US manufacturing PMI
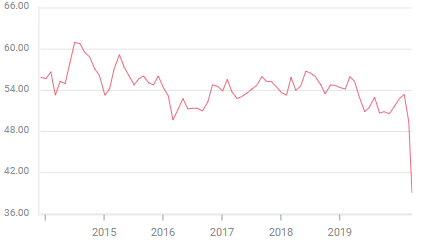
Services PMI for the US sank to 39.1 from 49.4 in February missing the 42 forecast. Both scores were the lowest in the seven-year history of the American series. The composite index dropped to 40.5 in March from 49.6.
IHS Markit US services PMI
FXStreet
Eurozone PMI
In the Euro zone the composite purchasing managers’ index plummeted to 31.4 in March from 51.6, its lowest on record and the largest one-month decline in the 22-year history of the series. The consensus prediction was 38.8.
“The March PMI is clearly indicative of GDP slumping at a quarterly rate of around 2%, and clearly there’s scope for the downturn to intensify further,” said Chris Williamson chief business economist at HIS Markit.
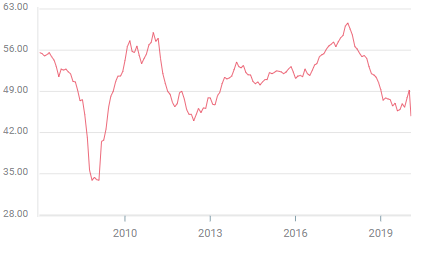
Activity in the EMU service sector shrank at its sharpest pace on record as PMI dropped to 28.4 from 52.6, missing all predictions.
IHS Markit EMU services PMI

FXStreet
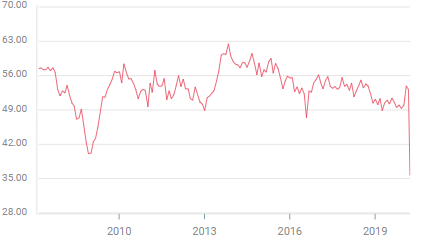
As in the US EMU manufacturing sentiment was less affected with the PMI slipping to 44.8 from 49.2, its weakest since July 2012 but ahead of the 39.0 median prediction.
IHS Markit EMU manufacturing PMI
FXStreet
US initial jobless claims
The US survey was conducted in the middle two weeks of the month, from March 13-23. In the subsequent week at least 18 states have orders non-essential business closed, though the directives vary from state to state.
Last week Labor Department data showed that unemployment claims jumped 70,000 in the March 14 week to 281,000. It was highest weekly total since early September 2017 and the largest one week jump since November 15th 2012.
US initial jobless claims

FXStreet
Estimates for last week’s initial claims figures which will be released on Thursday at 8:30 am range from 250,000 to 4 million with a median forecast at 1 million. If correct it would be the largest week on record topping the 665,000 at the height of the financial crisis in 2009.
UK PMI
In Britain the composite PMI skidded to 37.1 in March its weakest on record, from 53 in February. Services PMI dropped to 35.7 from 53.2, also an all-time low.
IHS Markit UK services PMI
FXStreet
The UK manufacturing PMI, as elsewhere, seemed less damaged by the spreading business closures, dropping to 48 in March from 51.7. The output component of manufacturing PMI was shrinking at its fastest rate since the Euro zone debt crisis in 2012.
IHS Markit UK manufacturing PMI

FXStreet
However, in a comment on the UK numbers which can be applied in concept to all of its surveys, IHS Markit said the seemingly resilient manufacturing numbers were reflecting the positive impact on the indexes of longer waits in obtaining supplies.
Normally delivery delays are caused by increased demand on the suppliers but in this case the reasons are the voluntary suspensions and shutdowns of plants and businesses ordered by public health authorities.
Purchasing managers’ indexes show that UK employment is falling at the steepest rate since July 2009.
Author

Joseph Trevisani
FXStreet
Joseph Trevisani began his thirty-year career in the financial markets at Credit Suisse in New York and Singapore where he worked for 12 years as an interbank currency trader and trading desk manager.


