Trend reversal setup emerging on the NZD/USD

The NZD/USD pair has been advancing in a solid uptrend since late-March, as the dollar started to lose its status as the most sought-after currency during the tumultuous times of the coronavirus crisis. Yet, this ostensibly bullish sentiment in the market could be affected in adverse ways this week because of major economic releases in the US and New Zealand.
On the one hand, the underlying market forecasts expect US consumer prices to have tumbled in July on weaker demand. Muted inflationary pressures would spell trouble for the struggling US dollar, as this would entail the continuation of FED's dovish monetary policy stance.
On the other hand, the Governing Council of the Reserve Bank of New Zealand is anticipated to maintain the near-negative Official Cash Rate unchanged from its current value of 0.25 per cent, again on Wednesday. Earlier today, New Zealand reported it first COVID-19 cases in months, which raises the likelihood of a second wave hitting the country.
These unwelcoming news, coupled with the extra volatility that is projected to emerge following RBNZ's meeting, could also hurt the value of the Kiwi. At its June meeting, the Council of the RBNZ cautioned against unfavourable exchange rates, which resulted in the NZD tanking following the publication of the monetary policy statement. Similar remarks on Wednesday could once again threaten the rally of the Kiwi.
While the market has already started pricing in the likelihood of yet another contraction of the US inflation rate, a lot of unknowns remain concerning RBNZ's meeting and the implications from a second coronavirus wave on New Zealand's economy. Hence, the immediate outlook for the Kiwi looks more muddled compared to the greenback.
1. Long-Term Outlook:
As can be seen on the daily chart below, the NZD/USD recently reached but failed to break out above the major resistance level at 0.67000 yet again, which represents the most significant indication of a potential trend reversal. The price action appears to be forming a new Distribution range, which, under the rules of the Wyckoff cycle, postulates the likely conclusion of the recent bullish trend.
Such a massive transformation of the underlying market sentiment could unfold in one of two baseline scenarios. Firstly, the price action might continue consolidating within the boundaries of the Distribution range, between the aforementioned resistance and the major support level at 0.65600, in the foreseeable future. Secondly, if a breakdown below set support does occur, subsequently the price action could head towards the next prominent support, which is represented by the 23.6 per cent Fibonacci retracement level at 0.64183.
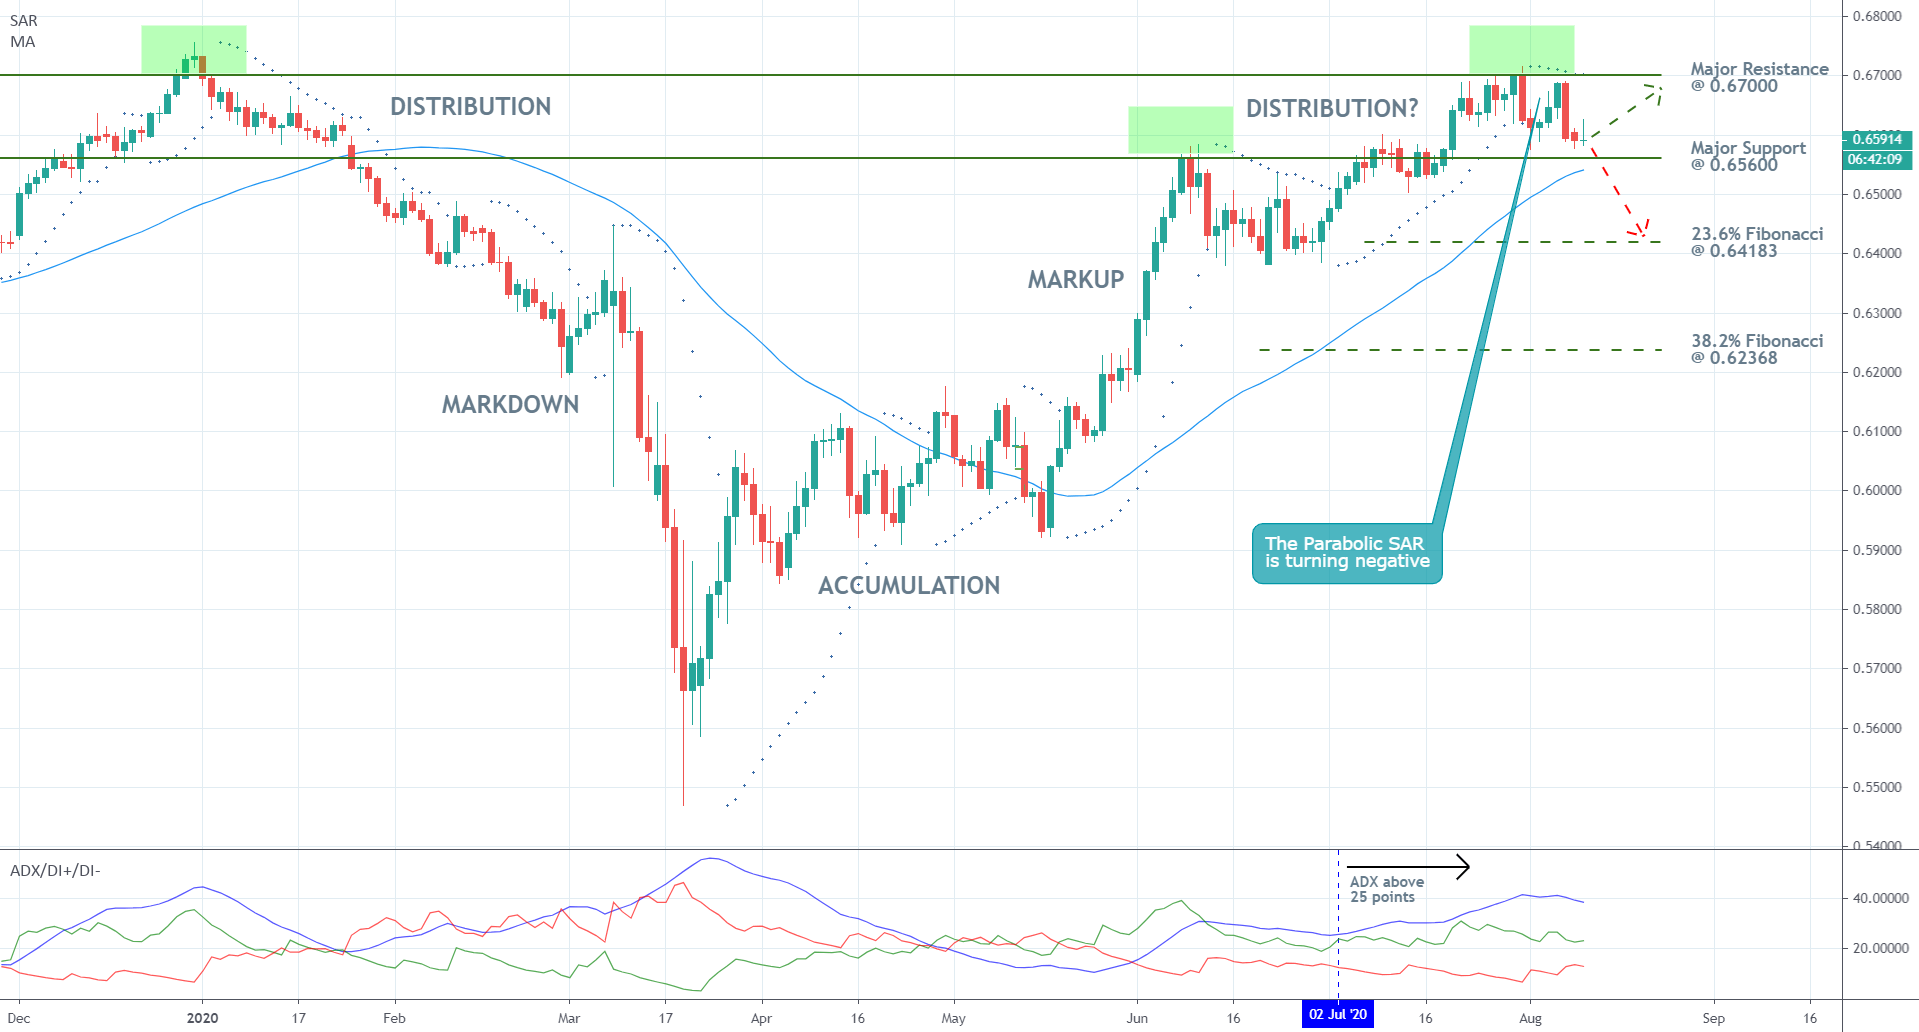
The Parabolic SAR indicator has recently started to underscore the waning strength of the uptrend, which could be perceived as an early indication of a forthcoming trend reversal.
Conversely, the ADX indicator is threading well-above the 25-point benchmark, which is demonstrative of an ostensibly trending environment. The development of the preceding uptrend has triggered this reading of the indicator, and for the time being, it diminishes the possibility for the emergence of range-trading conditions in the near term.
Finally, the price action remains concentrated above the 50-day MA (in blue), which is currently converging towards the lower limit of the Distribution range. The moving average serves as a floating support level, which means that a rebound of the bearish correction from it is quite plausible. However, should the price action manage to break down below the 50-day MA and the major support level at 0.65600, this would represent a significant confirmation of rapidly rising selling pressure.
2. Short-Term Outlook:
The rising bearish bias is more clearly visible on the 4H chart below. As can be seen from the Ichimoku Cloud indicator, the market has already adopted a more bearish outlook due to the fact that the cloud has turned red. Given that the pair is ostensibly trending, this development favours the continuation of the price action's descent further south.
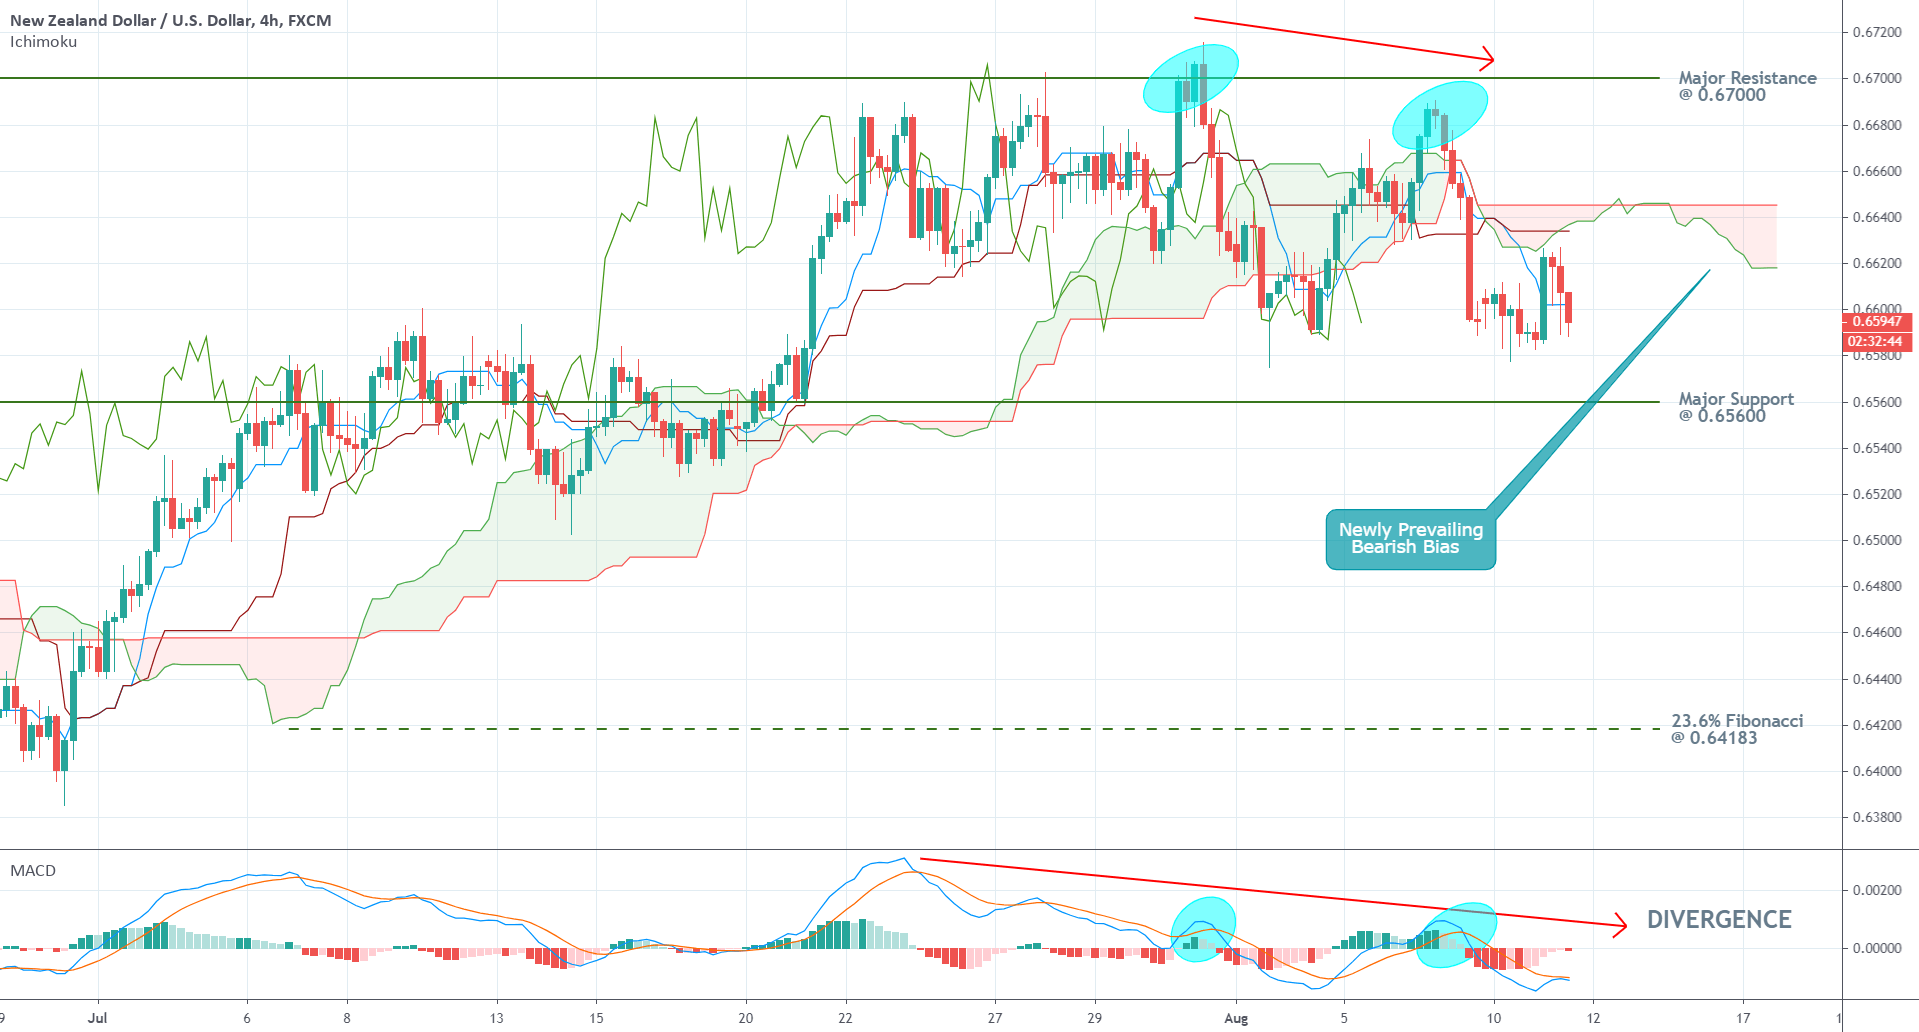
Moreover, the descending waves of the MACD indicator are pointing towards a currently evolving divergence. The underlying market momentum had already turned bearish before the price action started developing consecutively lower peaks (look at the blue spheres on the chart above), which is also welcoming news for the market bears. All things considered, there is ample evidence supporting the expectations for the development of a more massive downturn.
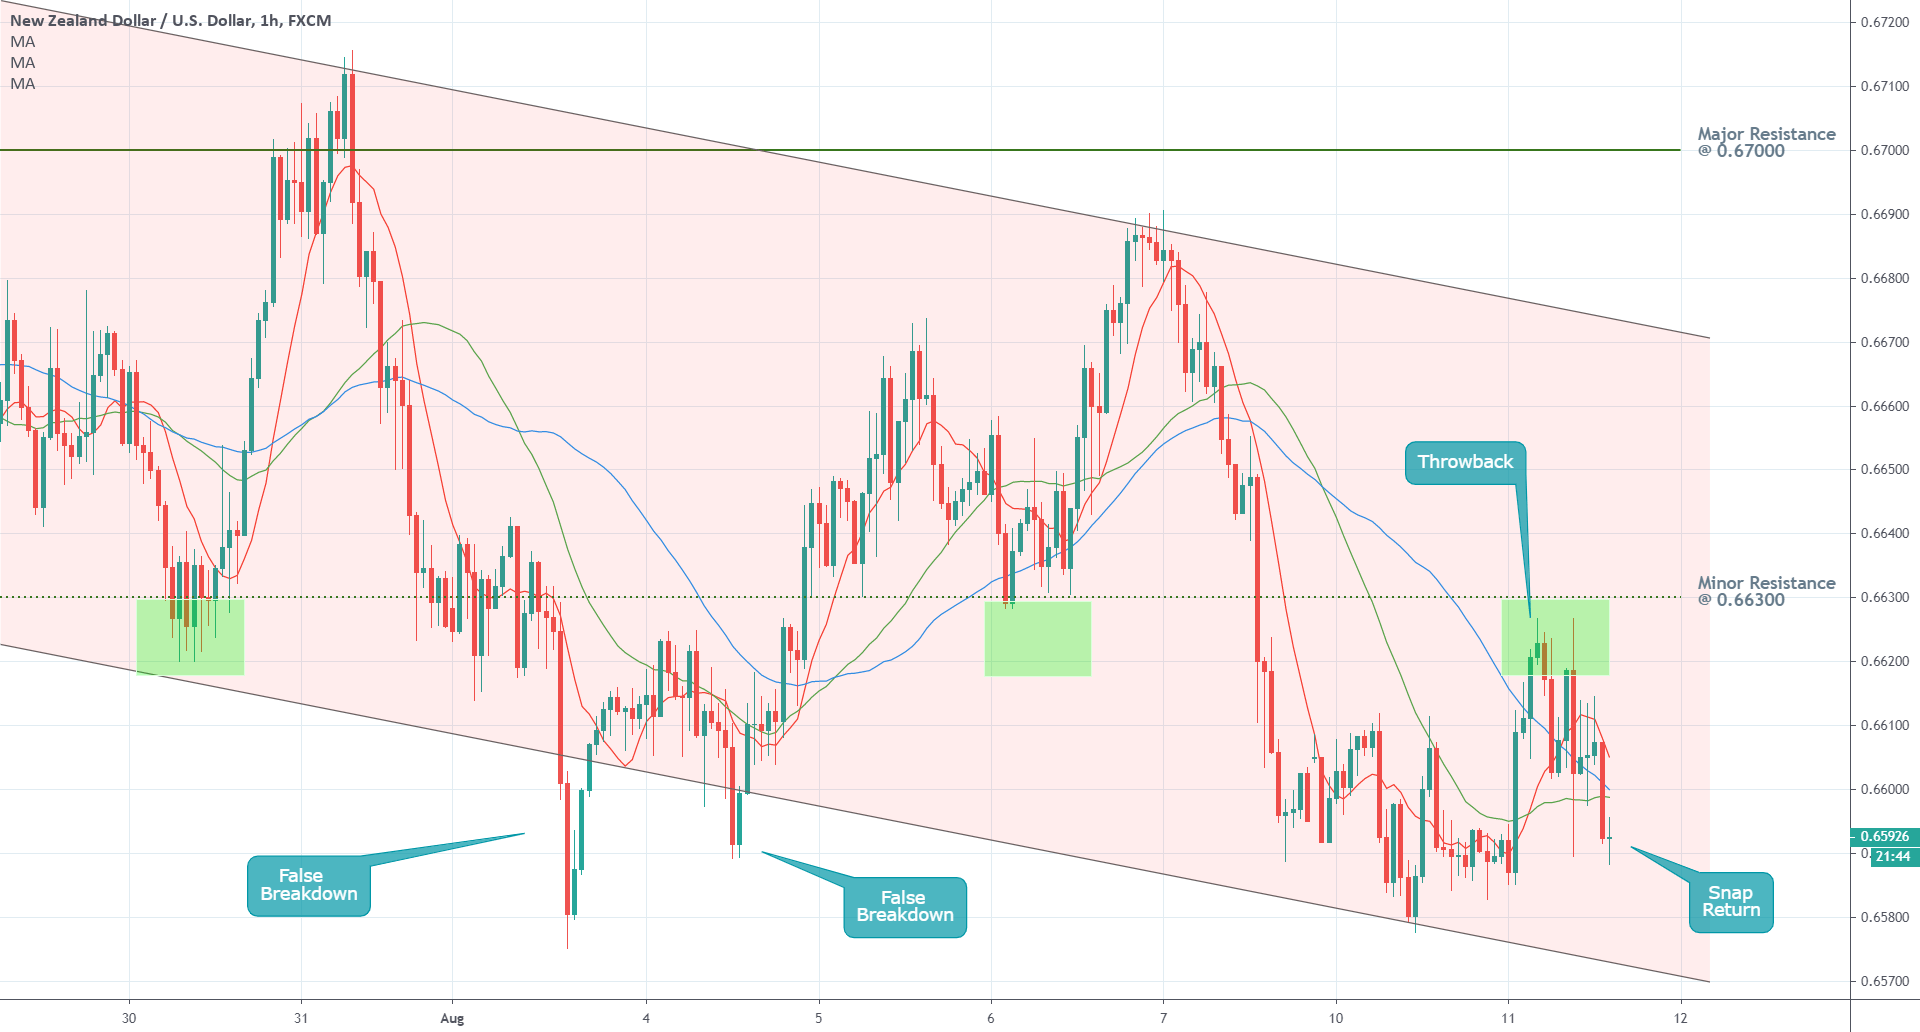
As can be seen on the hourly chart below, the price action is currently falling while being contained within the boundaries of a descending channel. After a minor bullish retracement, the price action resumed its descent, which can be affirmed from the relationship between the price action and the three moving averages.
The pair is once again trading below the 50-day MA (blue), which is above the 30-day MA (in green). If the 10-day MA (in red) falls below the latter two over the next several hours, this would be illustrative of mounting selling pressure. Consequently, there will be enough bearish commitment in the market for the price action to attempt a new breakdown below the channel's lower limit.
3. Concluding Remarks:
Although the underlying fundamentals are not definitively poised in either direction, an educated guess could be made as regards the likely impact of Wednesday's releases in New Zealand and the US on the underlying price action. The overall market pressure currently affecting the NZD/USD is likely to be tilted towards the downside in the wake of these data publications.
As regards the technical outlook, it could be stated that the underlying bearish bias is more pronounced on charts with lesser timeframes, while things look less straightforward on the daily chart. A decisive change from bullish to bearish sentiment, in the long run, is likely to be protracted and uneven, which means that bears should not count on the development of a snap and massive dropdown in the immediate future.
Author

Plamen Stoyanov
Trendsharks
Plamen started his career on the global capital markets in 2012 when he began trading with financial derivatives.


