Trading earnings announcements the smart way — prediction of SNAP direction [Video]
![Trading earnings announcements the smart way — prediction of SNAP direction [Video]](https://editorial.fxstreet.com/images/TechnicalAnalysis/Volatility/Bands (bollinger)/stock-market-graph-gm531397401-55485034.jpg)
Many traders or investors find that earning announcements are nerve-racking because of the high volatility involved in the share price. Often the top question that pops up in their mind is “Should I hold or sell before the earnings announcements?”
In this post, you will find out:
- How to use the Wyckoff’s Structure analysis to anticipate the direction of the share price.
- The most crucial element when trading the earnings announcements (majority of traders/investors overlook this)
- Case studies to illustrate the concept.
- Prediction of SNAP direction (Earning Announcement on 21 Oct 2021, Thurs, After Market Closed)
Wyckoff’s Structure Analysis
In order to determine if a stock is of accumulation or distribution bias, Wyckoff’s structure analysis is the first step one needs to proceed followed by volume spread analysis (VSA) for confirmation.
Below is the accumulation schematic from StockCharts.com:
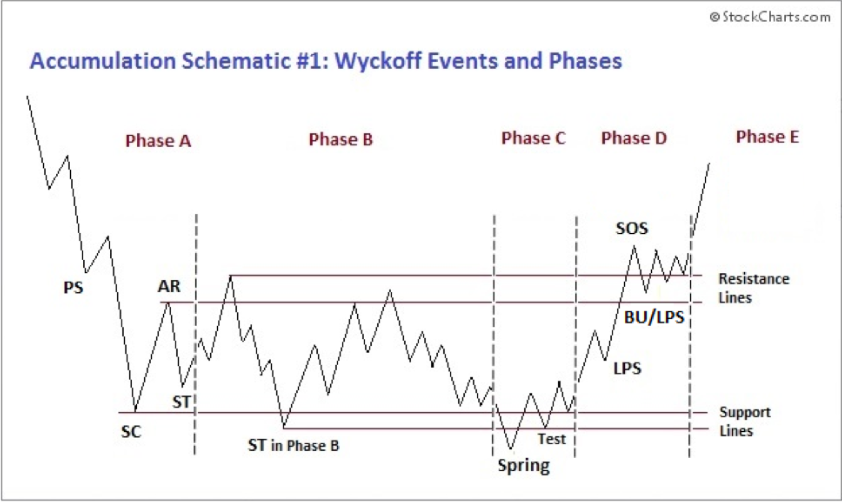
Based on the schematic above, one could develop different combinations of trading strategy (e.g. hedging while the stock is under accumulation or re-accumulation), short term swing in either direction leaning on the support and resistance, swing trading in mid to long term position trading, etc…)
In short, from Phase A to D, the stock is still under accumulation process where a lot of funds accumulate the shares by taking advantage of the high volatility, liquidity and prolong period of time while the accumulation trading range is unfolding. Once the accumulation is completed, the stock will enter into the markup phase (uptrend with a higher high and higher low), which is Phase E.
I bet majority of retail traders or investors would love to participate Phase E without getting stuck while the accumulation trading range is unfolding. This makes perfect sense since the uptrend is where the meats are and it is easier and smoother to participate the uptrend comparing to the trading range.
So, the focus is to look for stocks nearing completion of phase D where they can rely on the earnings announcements as the catalyst to complete the accumulation structure and enter into phase E, the markup phase.
The results of the earnings (above/below the expectations) are not the focus. Instead, the focus is how the price reacts to the earnings because the market is always right (not the analysts or traders like you and me).
Watch the video below to find out more on the application of Wyckoff accumulation structure in long term investing:
Crucial Element
The most crucial aspect majority of retail traders and investors overlook while trading the earnings announcements is the broad market direction as a rising tide lifts all boats!
A failure in the stock price actions such as a breakout failure, a reversal failure, etc… can be triggered by:
- Market
- Sector
- Industry Group
- Individual stock
Of course, from time to time, we will notice during market correction, some sectors are bucking the trend. Finance (XLF) and Energy (XLE) are great examples of outperforming sectors during the recent market correction as the rising interest rate anticipation.
Anyway, always pay attention to the broad market direction (e.g. ES, NQ, YM, RTY) when trading the earnings announcements.
Case Study 1 — BILL
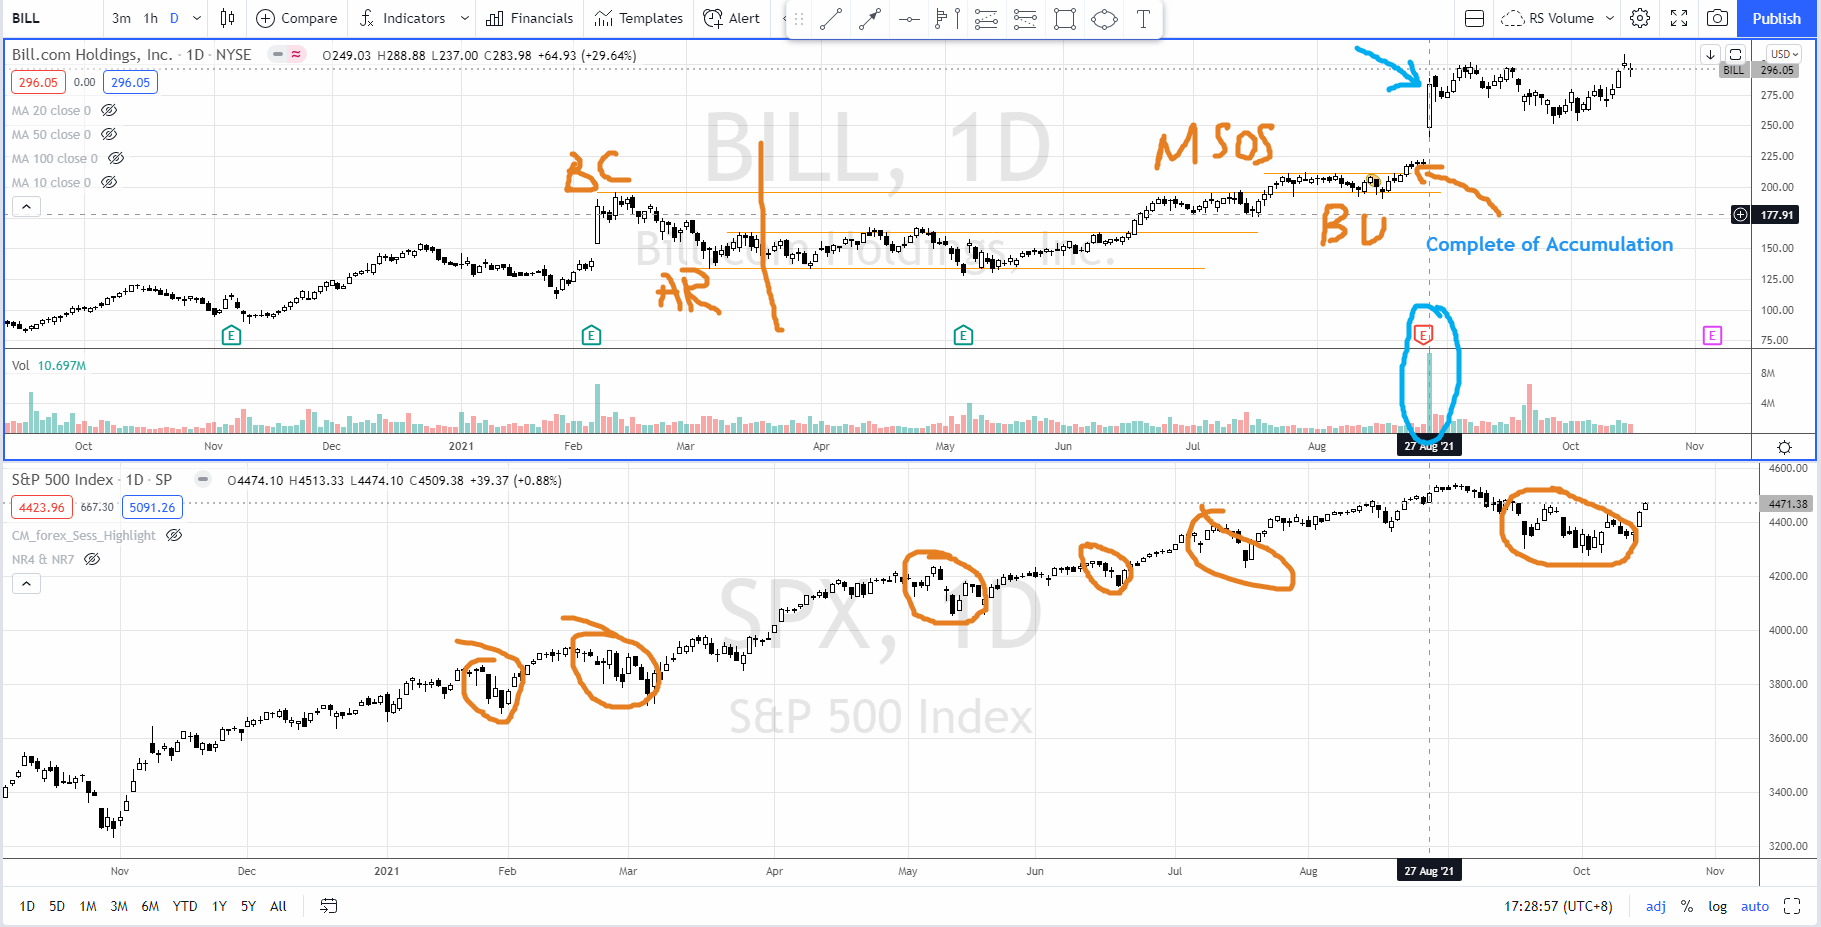
BILL had a beautiful re-accumulation structure from Feb-Aug 2021. The price just broke out from the backup (BU) action 4 days before the earning announcement on 27 Aug 2021. This satisfied the Wyckoff structure analysis where it had completed the re-accumulation structure.
In terms of the broad market (2nd pane, S&P 500), I have highlighted the pullback in orange where the volatility spiked. A few days before the earning announcement of BILL, the market is approaching all time high level, which is an encouraging sign for the bullish case. Both the structure and the market favor a bullish scenario for BILL to react positively upon earning announcement.
After the earning announcement, BILL jumped 30%. Note: please do not expect all stocks will go up by this much upon reacting the earnings announcements.
Case Study 2 — BAC
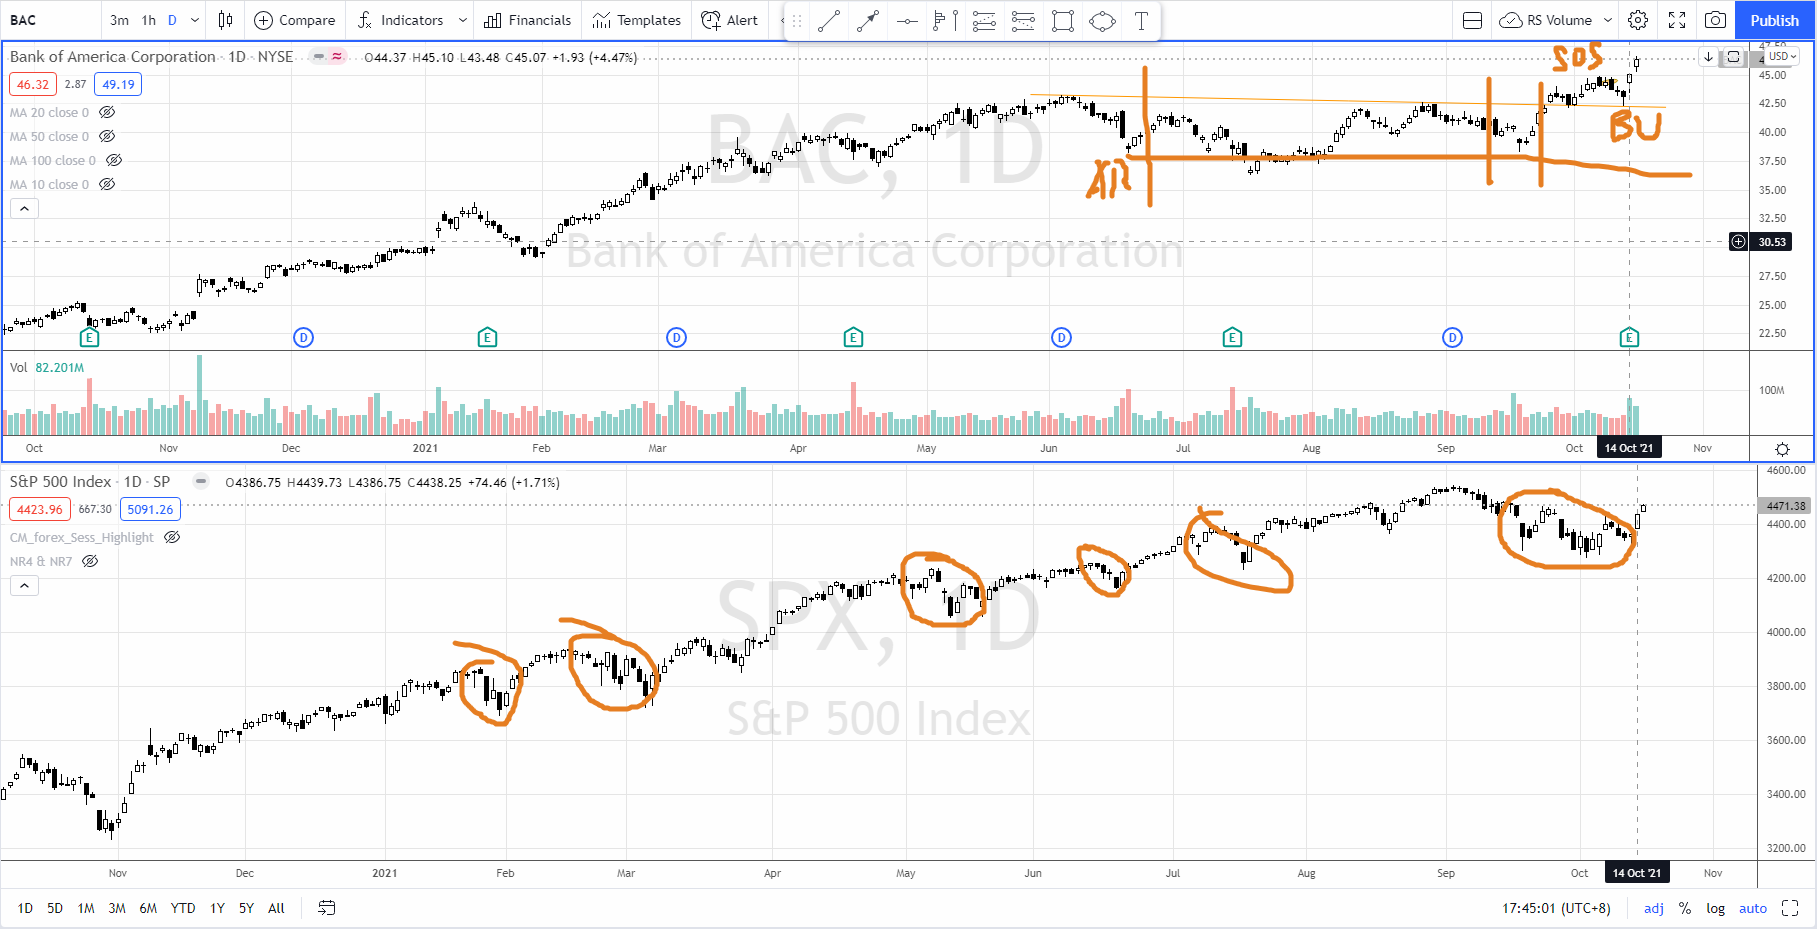
In terms of the structure, BAC had a “textbook style” re-accumulation structure from Jun-Oct 2021. Prior to the earnings announcement on 14 Oct 2021, it is in phase D backup (BU) action, nearing completion of the re-accumulation.
In terms of relative strength compared to the S&P 500, BAC had a sign of strength rally (SOS) followed by a backup action (forms a higher low with outperforming absolute return) since 20 Sep 2021 while the S&P 500 is barely flat. This shows that BAC was outperforming the S&P 500.
Despite the broad market (S&P 500) is under correction since 10 Sep, BAC and the finance sector outperforms the market. This favors a bullish scenario for BAC to react positively upon the earning announcement on 14 Oct 2021.
After the earning announcement, BAC jumped 4%+. Subsequently it hit all time high on 15 Oct 2021, entering into phase E — uptrend environment.
Prediction of SNAP direction (Earning Announcement on 21 Oct 2021)
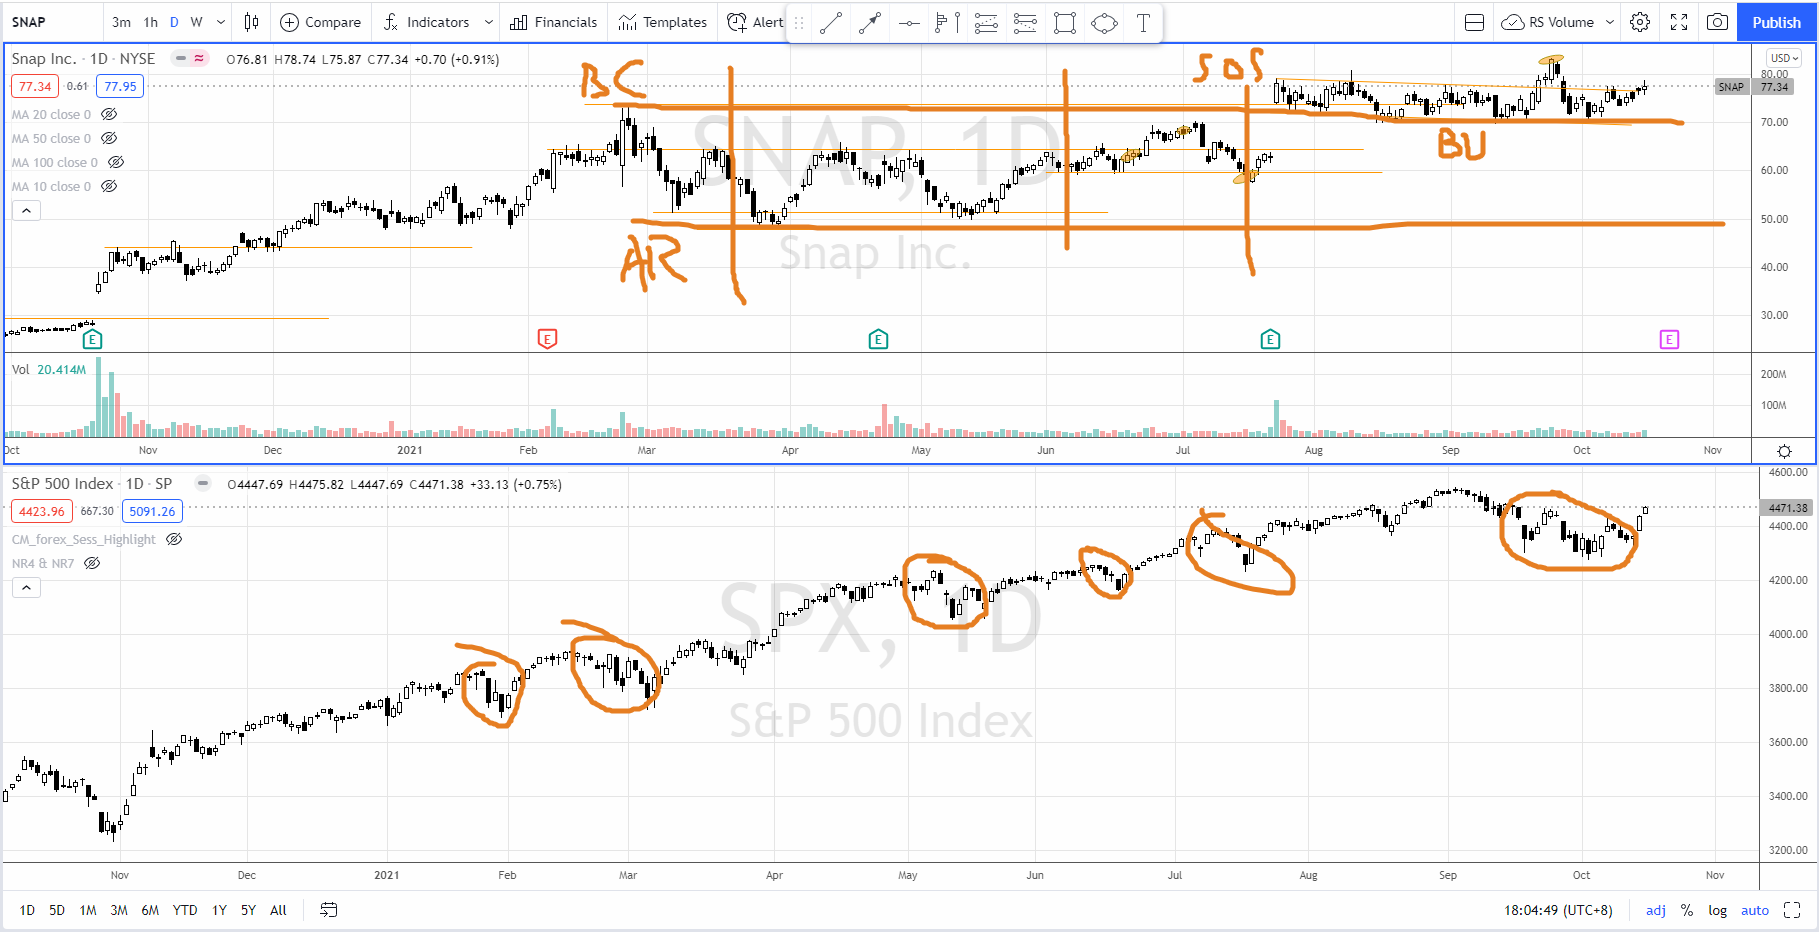
From the price structure aspect, SNAP had a sign of strength rally in July 2021 committed above the previous swing high resistance followed by a trading range as a backup (BU) action. Once it completes this accumulation structure, the next phase is the markup phase, which is the start of the uptrend.
The S&P 500 formed a higher low on 13 Oct 2021, which could suggest that the temporary bottom is formed. For a bullish case, S&P 500 could go back to test the all-time high before the next reaction unfolds.
Both the price structure and the market (S&P 500) paint a bullish picture for SNAP to react positively on earning announcement on 21 Oct 2021.
Do your own due diligence and come up with a trading plan before execution. Just like any other methods, there is no 100% winning rate. Risk management plays a key role in trading and investing. If you have mastered the skillset, you will have an edge in the market. Over the long run, your edge will play out based on the law of large number. This is the route to consistently profit from the market in the long run.
Author

Ming Jong Tey
Independent Analyst
Ming Jong Tey has been trading since 2008. He started his learning journey from technical analysis (indicators, Fibonacci, etc...) to value investing. Throughout his journey, he develops an interest in price action with chart pattern trading.


