Will the rising interest rate crash the stock market [Video]
![Will the rising interest rate crash the stock market [Video]](https://editorial.fxstreet.com/images/Macroeconomics/CentralBanks/InterestRate/discount-and-commission-gm469262638-61409818.jpg)
Last Friday the US 10 year treasury yield (TNX) spiked to 1.60, the highest since July 2021.
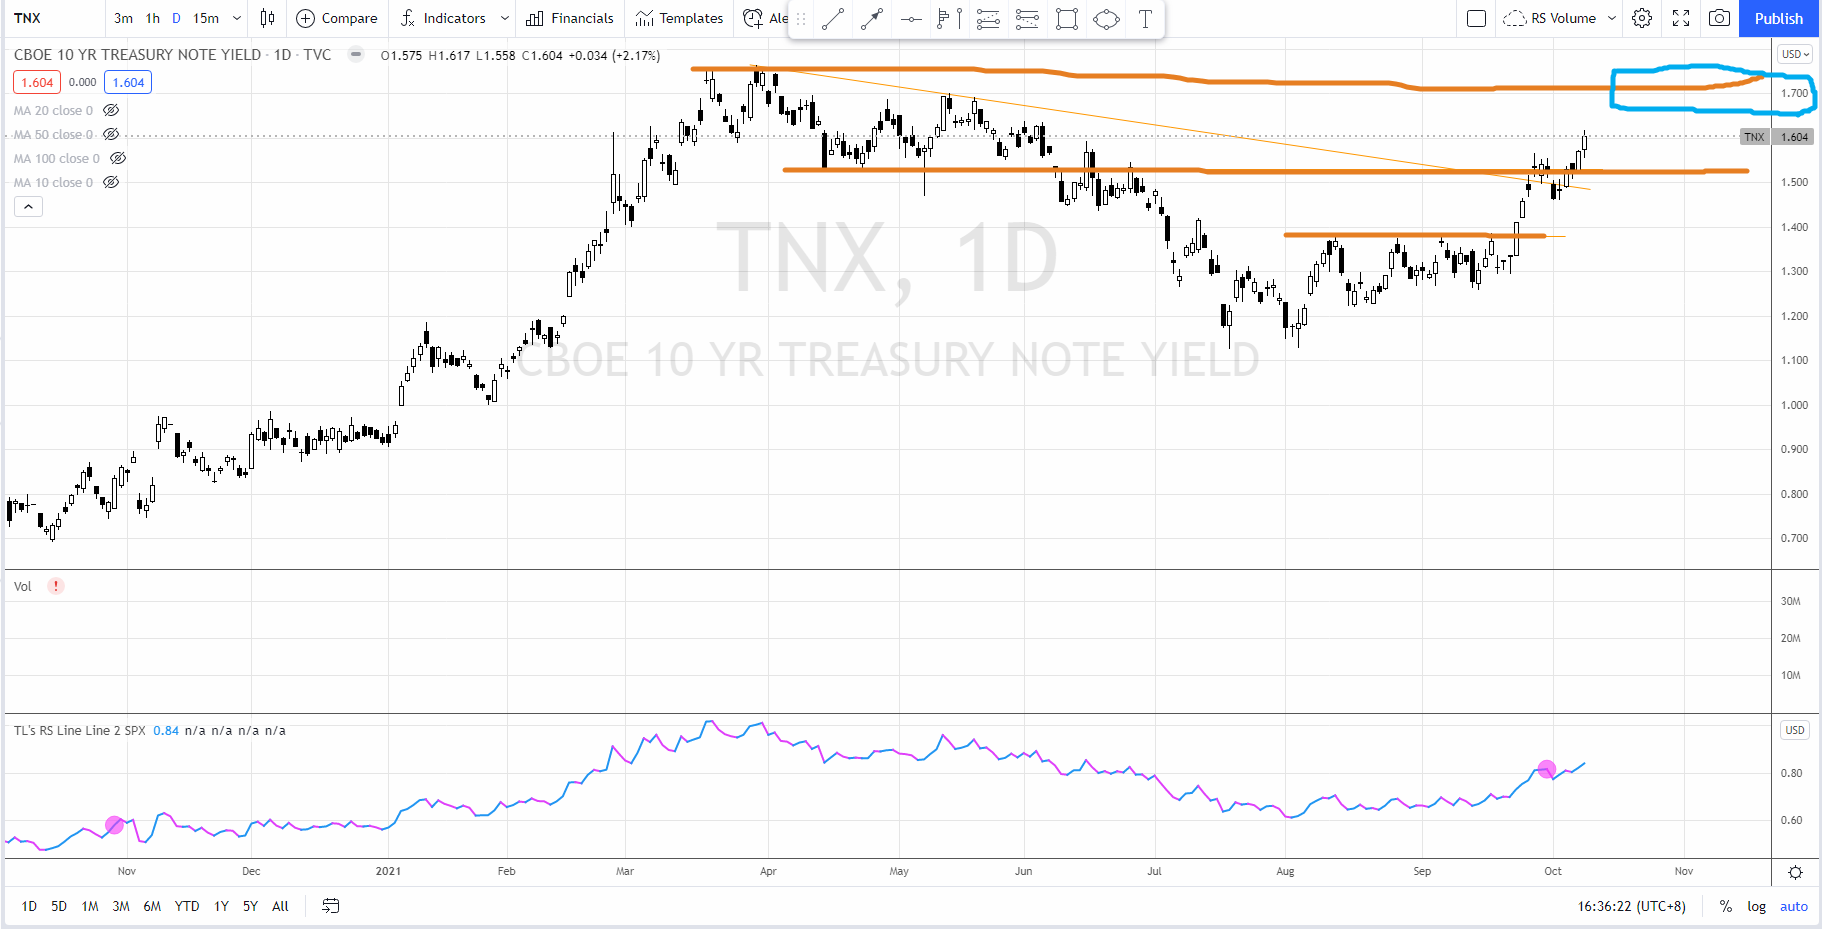
Based the daily chart above, TNX broke out from the Wyckoff accumulation structure 2 weeks ago and tested the axis line (where the support-turned-resistance) at 1.5 followed by a shallow reaction.
Last week, TNX was on the move again and broke the swing high resistance at 1.5 and close at the recent high at 1.60. It is likely to test the previous swing high formed in March 2021 at 1.7 (as shown in the blue box).
While the 10 year yield is on the rise, how does it affect the stock market? Let’s look at the NASDAQ 100 futures (NQ).
NASDAQ 100 Futures (NQ)
Firstly, why look at NASDAQ? While the 10 year yield (TNX) is rising, NASDAQ (plus other growth stocks) is generally under pressure as they tend to have an inversely proportional relationship.
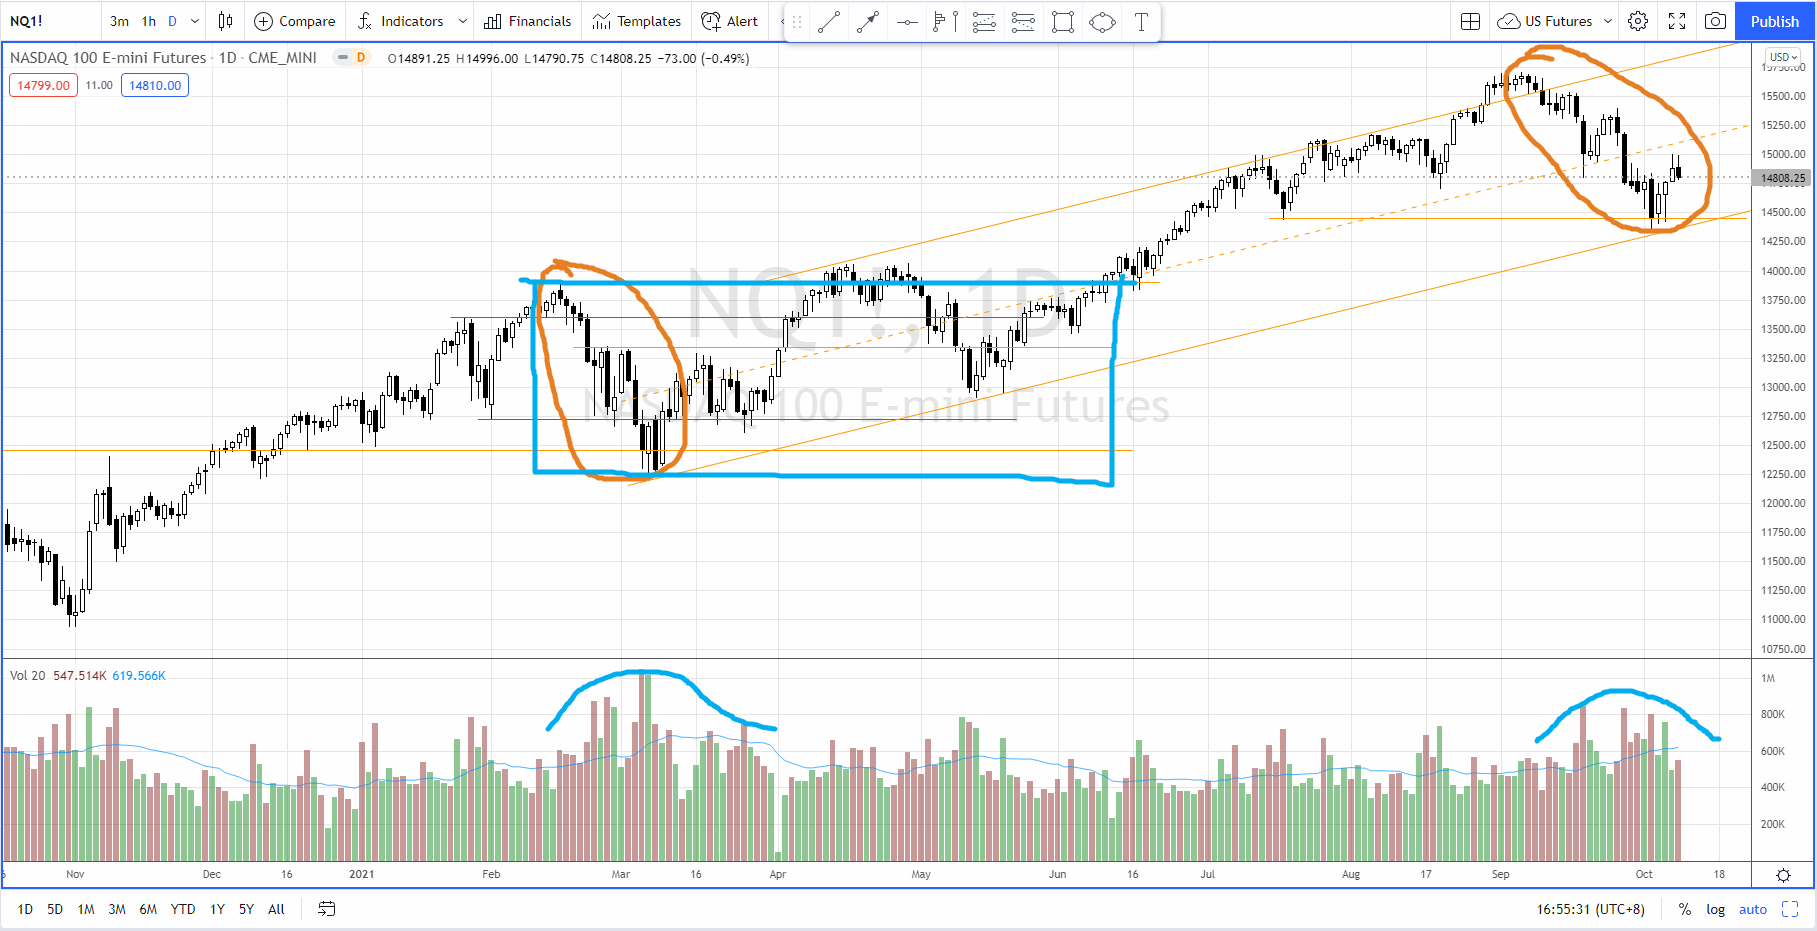
As shown in the daily chart above, Nasdaq is still in a very well defined long term up channel since Mar 2021. So long term trend is still up.
The down wave started in 20 Sep coincided with the breakout of the 10 year treasury yield (TNX) confirmed the inversely proportional relationship between Nasdaq and the TNX.
The characteristics of the the current down wave (which is still unfolding) is similar to the one in Feb 2021 while the supply level is slightly lower (as circled in orange). Last Wednesday (6 Oct) the bull finally showed some serious action which is reflected in the hammer price action and the spike of the demand. This is further confirmed on the next two days.
The bull is now given a chance to rally up to at least testing the supply zone at 15000–15200. We need to judge the quality of the coming rally. If the bull can take over from here on, we can expect a potential re-accumulation range like Feb-Jun 2021 (as boxed up in blue).
Instead of having a market crash, a re-accumulation is what I anticipate while the rotation is on-going to benefit the small cap (Russell 2000) as I mentioned in the past 3 weeks.
Let’s pay close attention to the characteristics of the price action (with the volume) in the coming week and to trade accordingly. Meanwhile, we can focus on the Financial ETF as the 10 year yield is rising because there are quite a number of the stocks in a great position to start the markup phase.
Meanwhile, there are still plenty of trading opportunities in the stock market. Watch the video below to find out how to trade the reversal and breakout with high confidence level.
Author

Ming Jong Tey
Independent Analyst
Ming Jong Tey has been trading since 2008. He started his learning journey from technical analysis (indicators, Fibonacci, etc...) to value investing. Throughout his journey, he develops an interest in price action with chart pattern trading.


