The Semiconductor Index rally is underway: Where will it top out?

In our previous update of April 8, when the Semiconductor Index (SOX) was trading in the low 3700s, we answered the question of whether it was ready to rally by using the Elliott Wave (EW) Principle and concluded, “In the short term, we expect the downside to continue to ideally $3,253+/-70, contingent on holding below last Wednesday’s high at $4,374, with a severe warning for the bears above $4,129. However, we don’t sweat the small stuff (a few 100p) as our long-term view remains the same as last week: a rally back to ideally ~$5,700 (several 1000p).” Fast forward, and the index bottomed that day at $3484 while now trading around $4430. See Figure 1 below. Although we missed the ideal bottoming target zone by only 161 points (4.8%), it has been up by 700 points (19.8%) since our article. Indeed, as we said, “…we don’t sweat the small stuff (a few 100p) as our long-term view remains the same as last week: a rally back to ideally ~$5,700 (several 1000p).” As a good professional trader and investor, we focus on the money-making move: the several 1000p rally, not the final few scribbles.
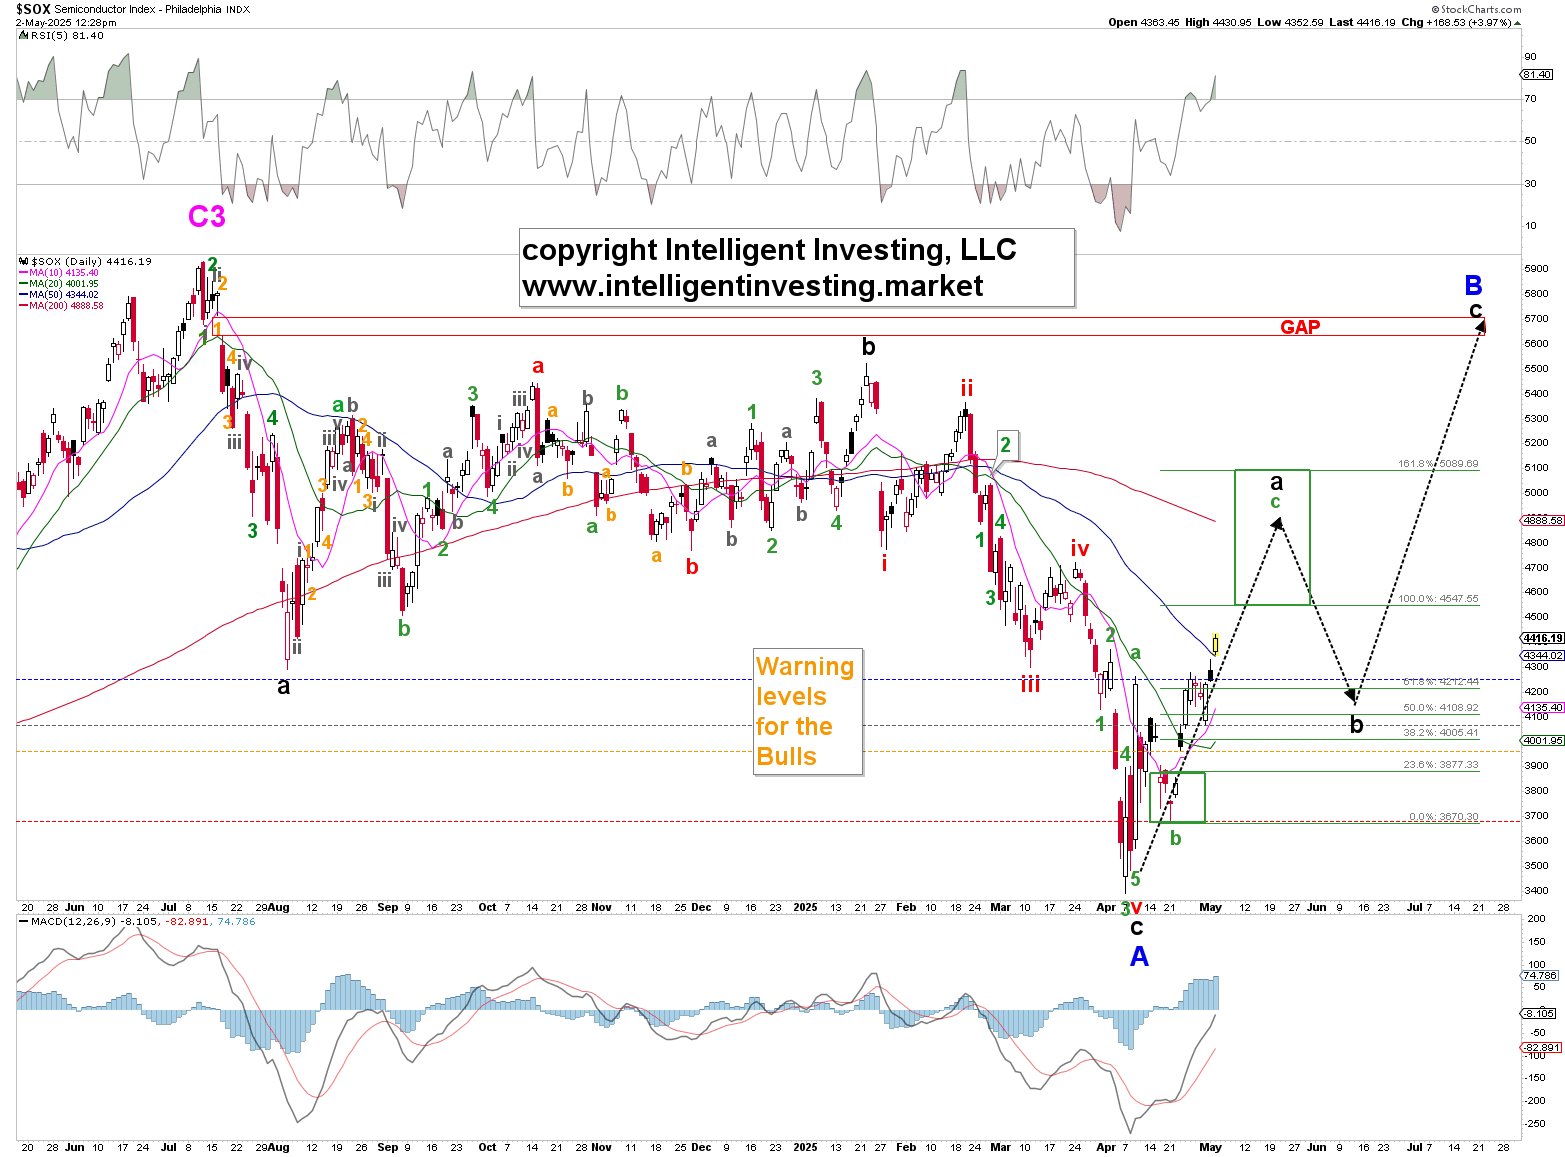
The index did not drop as low as expected, based on an ideal, standard, Fibonacci-based impulse pattern, because it experienced a failed 5 th wave. What does that mean? It means the final fifth wave of, in this case, the decline, does not go below the end of the 3 rd wave. Truncation of the 5 th waves can always happen, but cannot be known beforehand. Hence, we start with the ideal Fibonacci-based impulse pattern, and when it is invalidated, we apply, in this case, a truncated pattern. Therefore, “all we can do is anticipate, monitor, and adjust, if necessary.” Once you master this insight, the stock market suddenly becomes much easier to understand, forecast, and trade. The Big Picture. Since our EWP count indicates an enormous Cycle-3 wave peaked in 2024, as shown in Figure 2 below, we are currently experiencing a Cycle-4 wave. Fourth waves are typically described in EW terminology as flat corrections. Additionally, EW theory includes a rule of alternation: Wave 4 differs from Wave 2. In this context, Cycle W-2 was an extended nine-year-long zigzag; therefore, Cycle W-4 is likely to be a multi- year flat.

Flat corrections follow a 3-3-5 pattern (A-B-C = abc-abc-12345), where A is approximately equal to B and C in its most basic form. Therefore, the first leg (A = abc) is complete, as it bottomed right in the ideal target zone (black rectangle), and the second leg (B = abc) is now underway. Since A is approximately equal to B in this case, we should expect the index to return to the $5,000s, with a gap fill around $5,700 as a potential target, following the outlined black dotted path. In the short term, we expect the upside to continue to ideally $4550-5090, depending on which Fibonacci extension is operable (c=a to c=1.618x a, see Figure 1), and contingent on holding above $3963. Once the target zone for the black W-a is reached, and we will monitor it daily for our premium members to nail that top, we can better assess where the black W-b will bottom before the black W-c, ideally, $5700, takes hold. But for now, the black W-b should hold the $4200-4300 support-resistance zone.
Author

Dr. Arnout Ter Schure
Intelligent Investing, LLC
After having worked for over ten years within the field of energy and the environment, Dr.


