The Nasdaq torn between bears and bulls ahead of the election results
Just mere hours before the election results from each separate state start pouring in, the stock market is at an impasse. Yesterday, tech stocks were able to recuperate slightly following a massive plunge last week, which is a sign of resistance from the market bulls. Nevertheless, the continuation of the bullish rally is still very much in question.
Depending on who wins tonight, the Nasdaq is likely to react in slightly different ways. If its Biden, the index could continue fluctuating in a narrow range, possibly extending the bearish correction in the near future. That is so because of his tax plans for the wealthy, and the general perception of how such bigger taxes could impede the stock market's performance.
Such downbeat reactions to a Biden presidency are highly unlikely to persist for too long, as he has been leading steadily in the polls since April. This means that the market has had enough time to price the longer-term implications of a democratic administration at the White House. Moreover, the accommodative monetary policy stance of the FED coupled with the robust economic performance that has been observed recently – manufacturing and durable goods orders - should continue to support the stock rally.
If, however, Trump manages to snatch a somewhat surprising re-election tonight, the Nasdaq could jump, similarly to what happened in the wake of the 2016 republicans' victory. That is so because Trump pledged to keep the American economy open, despite the surging coronavirus cases in the states.
As regards Biden's agenda for tackling the pandemic, he seems more likely to reintroduce partial lockdowns in areas with confirmed infection spikes. Even if he does so, the technological sector has already demonstrated substantial resilience to the adverse fallout from such economic closedowns during the first wave, so there is no logical reason to expect a Biden's presidency to bring about an end to Nasdaq's rally.
Overall, a fundamental examination of the Nasdaq reveals that the index is most probably going to continue advancing further north in the longer-term. However, depending on who comes on top tonight, the tribulations for the index could be extended in the near future before bulls regain full control.
1. Long-Term Outlook
As can be seen on the daily chart below, the price action of the Nasdaq could have already established a Double Top pattern just above the psychologically significant resistance level at 12000.00. While such patterns typically entail the development of bearish reversals, this does not necessarily have to be the case at present.
The index is currently consolidating just above the 100-day MA (in blue), which represents a crucially important floating support, and a potential turning point for the direction of the price action. Moreover, the moving average is presently converging towards the 23.6 per cent Fibonacci retracement level at 11103.68, which, too, bears considerable psychological significance.
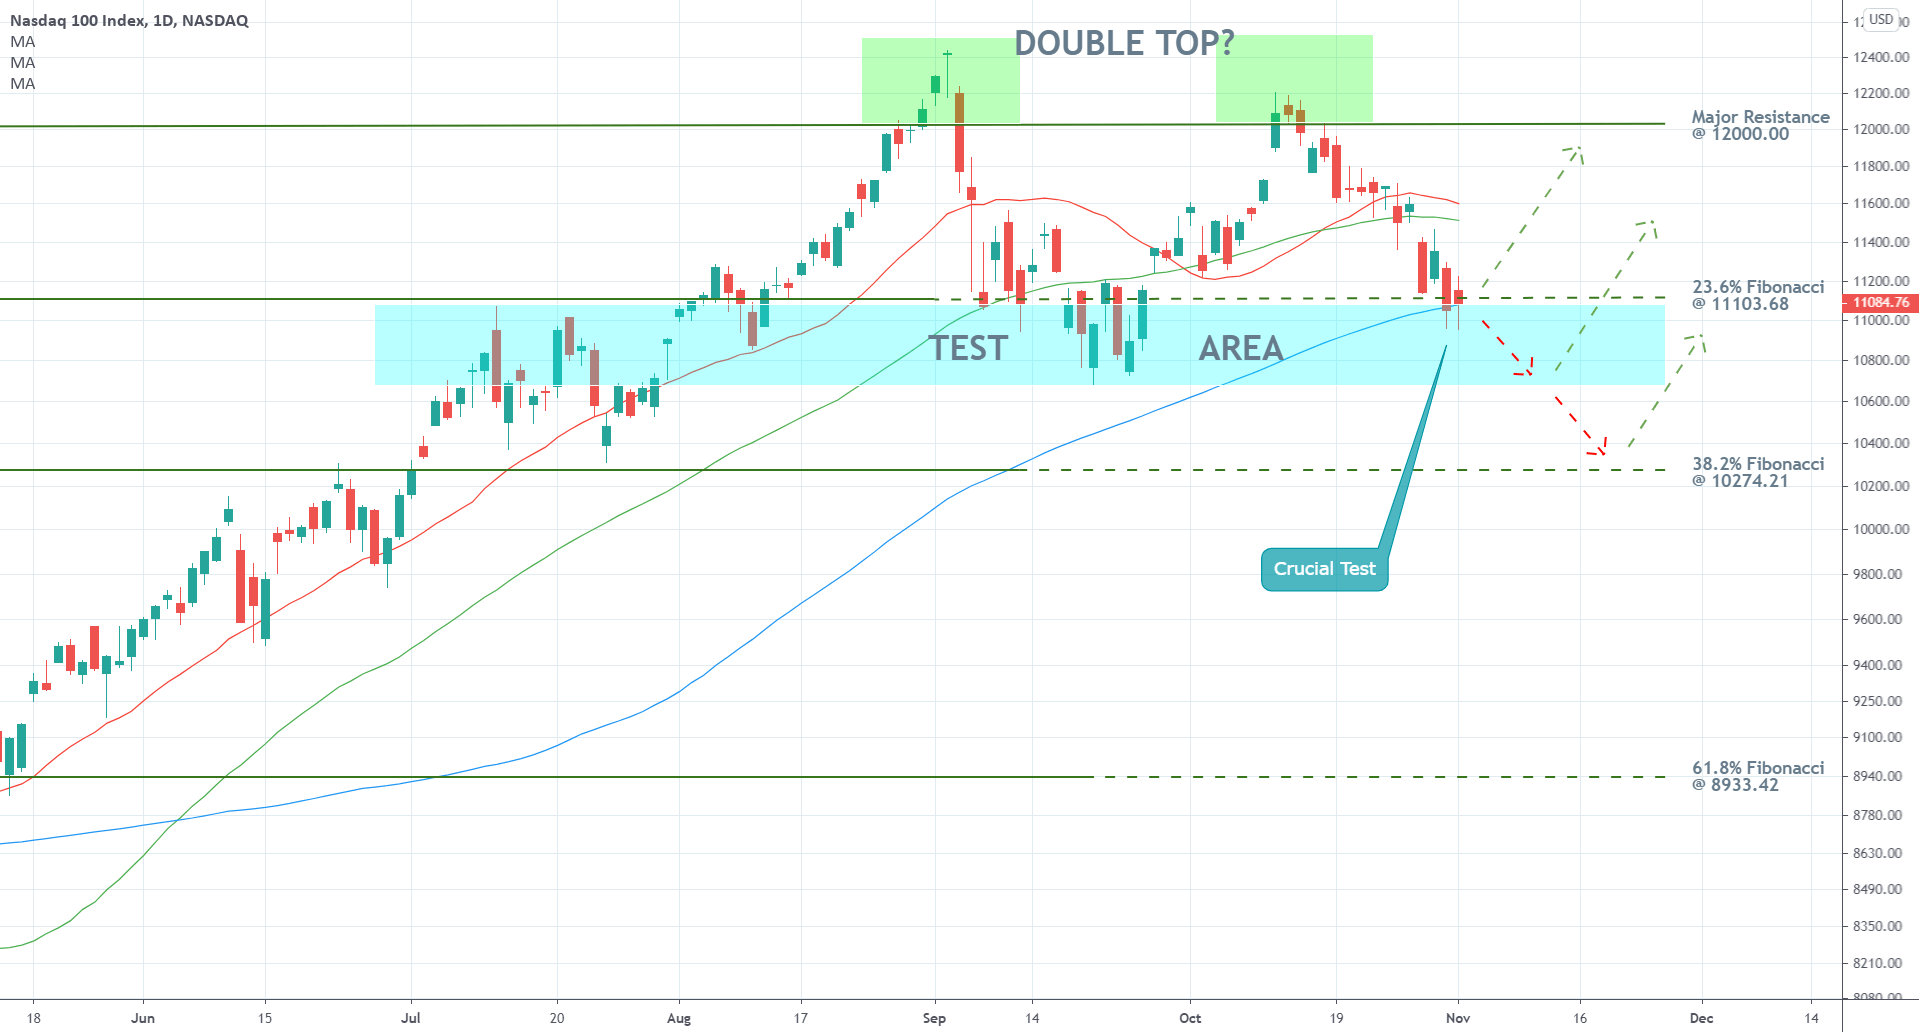
Given that the 20-day MA (in red) remains threading above the 50-day MA (in green), a termination of the current bearish correction seems highly probable to occur now, at the spot price. If, however, the price action fails the current test level and breaks down below the 23.6 per cent Fibonacci, it could consolidate within the boundaries of the Test Area next.
The lowest that the price action could tumble to before the bulls regain control is the 38.2 per cent Fibonacci retracement at 10274.21. Correspondingly, the next bullish upswing is bound to test the psychological barrier at 12000.00 one more time.
2. Short-Term Outlook
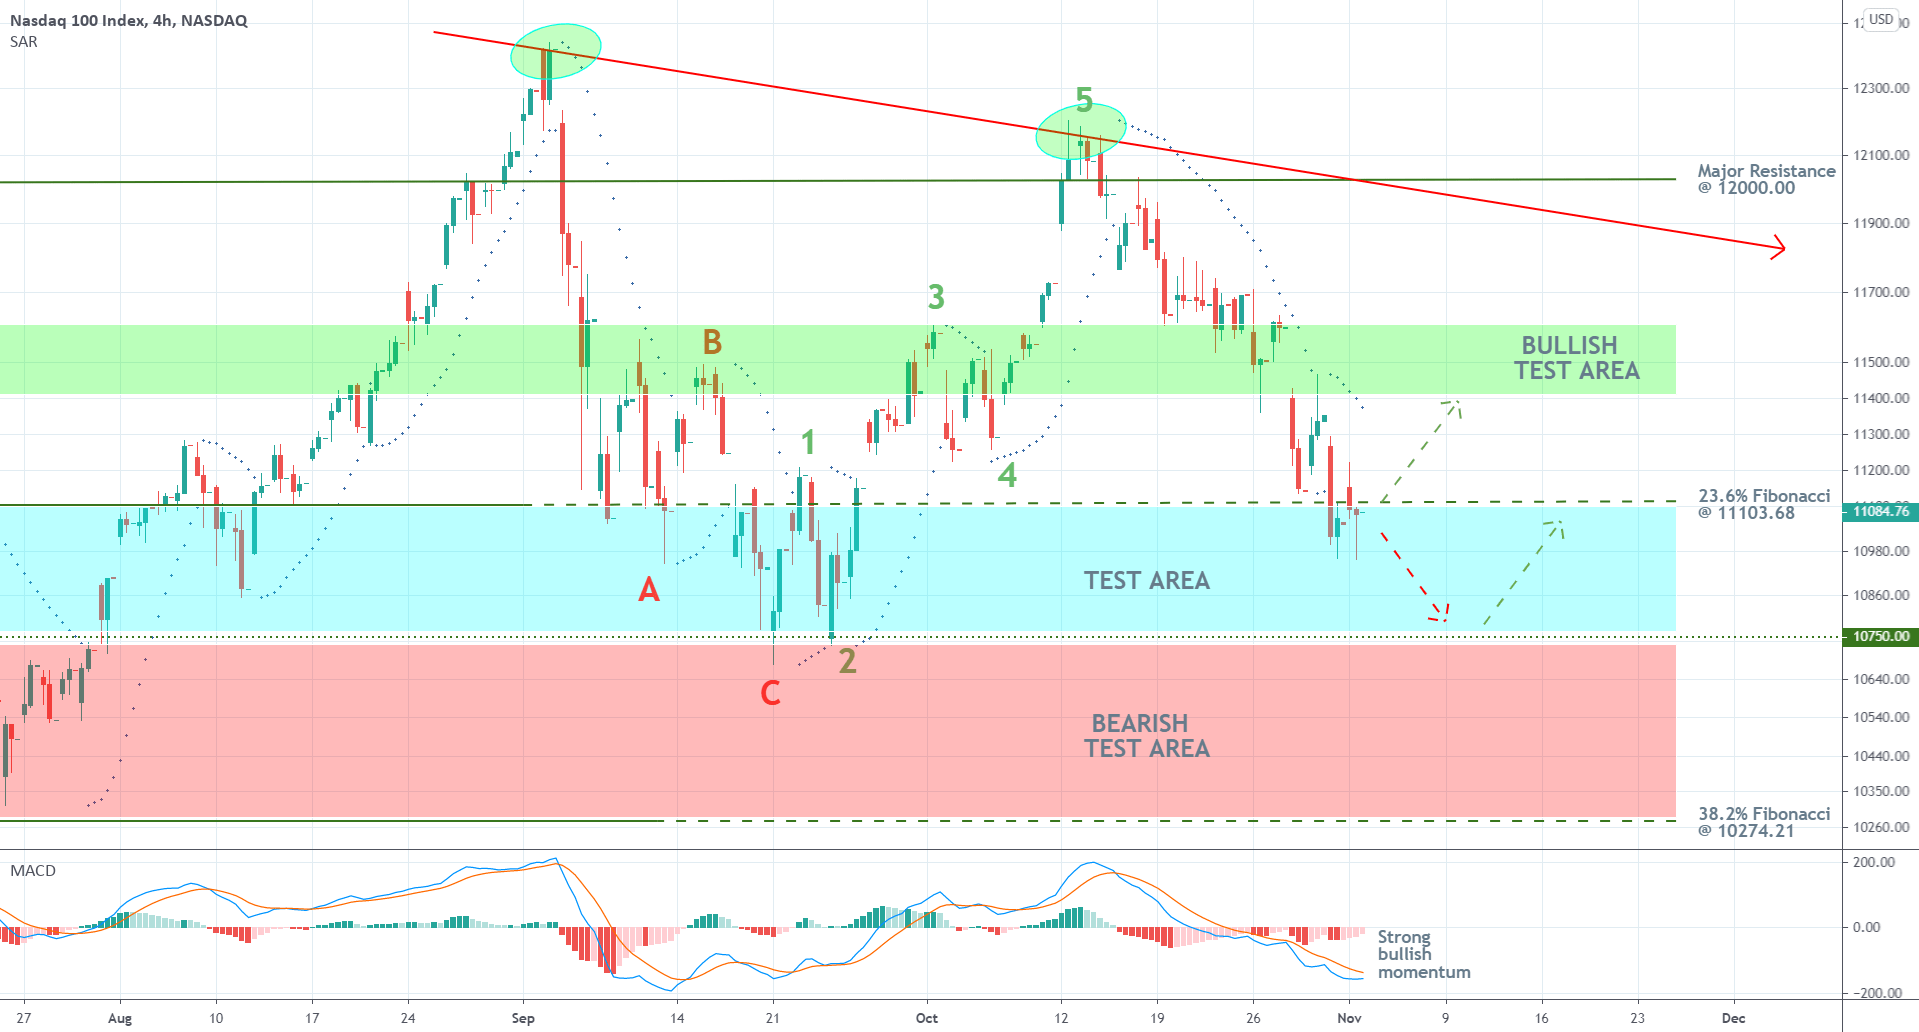
The technical outlook on a chart with a smaller timeframe is slightly different. The price action is currently probing the upper boundary of the Test Area, which is encapsulated by the 23.6 per cent Fibonacci, as can be seen on the 4H chart below. Its lower limit can be found at around the 10750.00 price level.
The latter is determined from the lowest point of the ABC correction that ensued following the Nasdaq's all-time record at around 12400.00 – the dip at point C. After the ABC correction was completed, the price action went on to establish a bullish 1-5 impulse wave pattern, as postulated by the Elliott Wave Theory. It peaked at point 5 just above the major resistance at 12000.00. From it, a descending trend line can be drawn, which could then be used to test subsequent bullish upswings.
Notice that the area around the peak at point B and the height of the impulse leg 2-3, serves the role of a major Bullish Test Area. Hence, the strength of any future upswings is likely to be tested within set area, and the behaviour of the price action within this area is going to demonstrate traders the exact extent of the underlying bullish commitment in the market.
Conversely, a breakdown below 10750.00 would mean that the price action is ready to enter within the Bearish Test Area, which correspondingly would test the underlying bearish commitment in the market.
At present, the prevalence of selling pressure could be inferred from the MACD indicator, which is underpinning strong bearish momentum, and also from the Parabolic SAR indicator.
3. Concluding Remarks
In determining how to position themselves, traders need to observe two key developments – the outcome of the US Election, and the behaviour of the price action around the 100-day MA. Overall, the underlying market setup seems favourable for the implementation of trend-continuation strategies around the aforementioned moving average; however, the bulls should keep in mind that the anticipated surge of uncertainty stemming from the Presidential Race could cause adverse bearish fluctuations in the near future.
Author

Plamen Stoyanov
Trendsharks
Plamen started his career on the global capital markets in 2012 when he began trading with financial derivatives.


