The Chart of the Week: Gold correcting towards critical resistance from fresh bear cycle lows
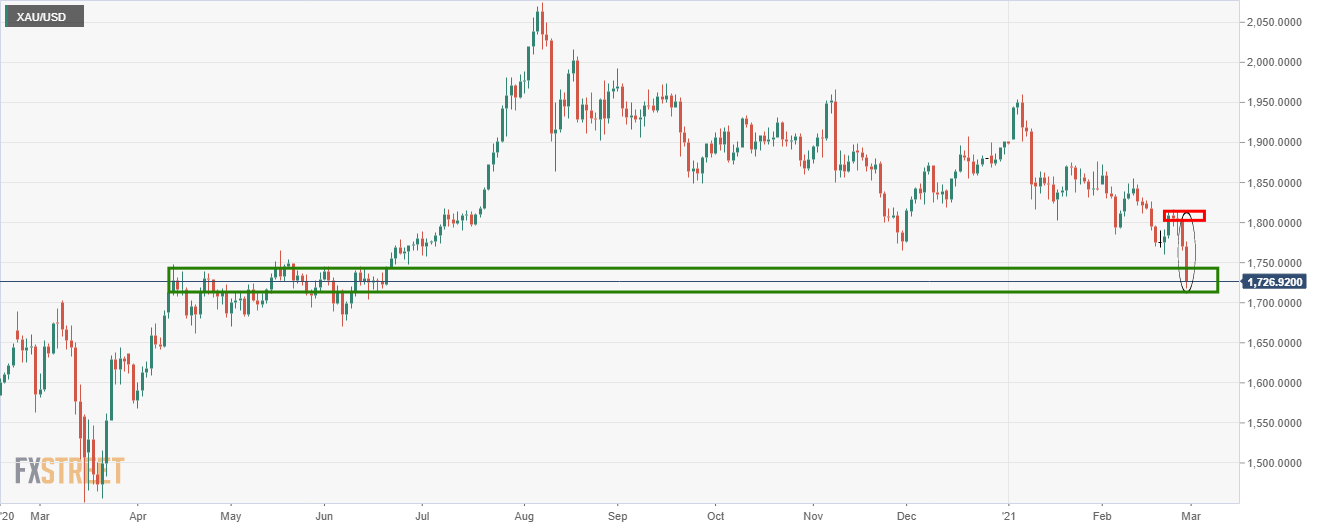
- Gold bulls stepping in at a daily demand area.
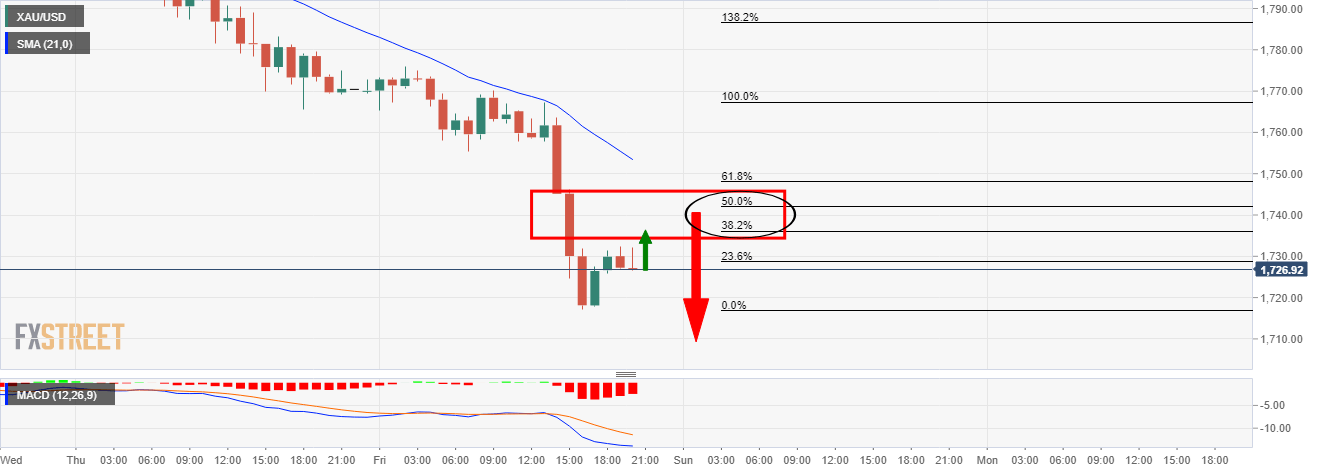
- $1,735/45 to be tested in the correction in a 50% mean reversion of hourly bearish impulse.

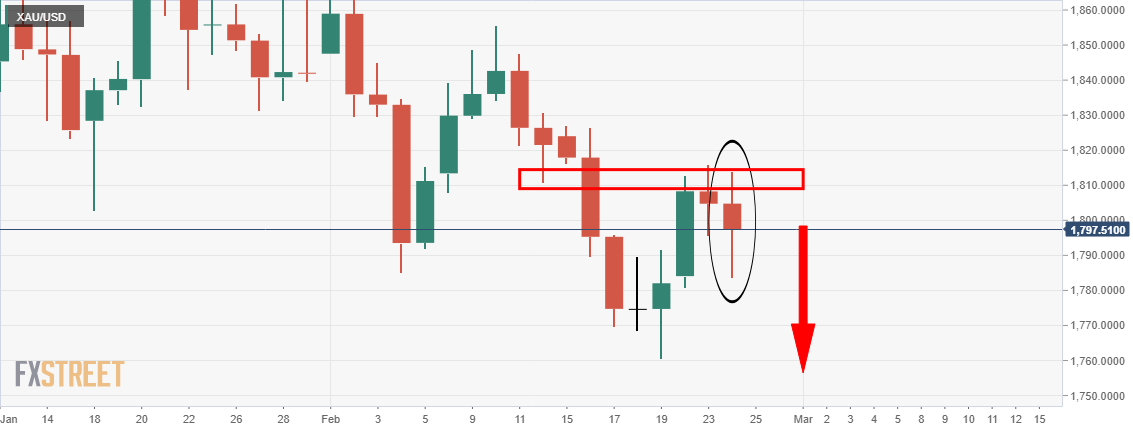
As per the prior analysis, Gold Price Analysis: Bears about to burst out of their cage to target $1,745.80, we did see repeated failures at critical support and the price subsequently plummeted.
Prior analysis, daily chart
Live market, daily
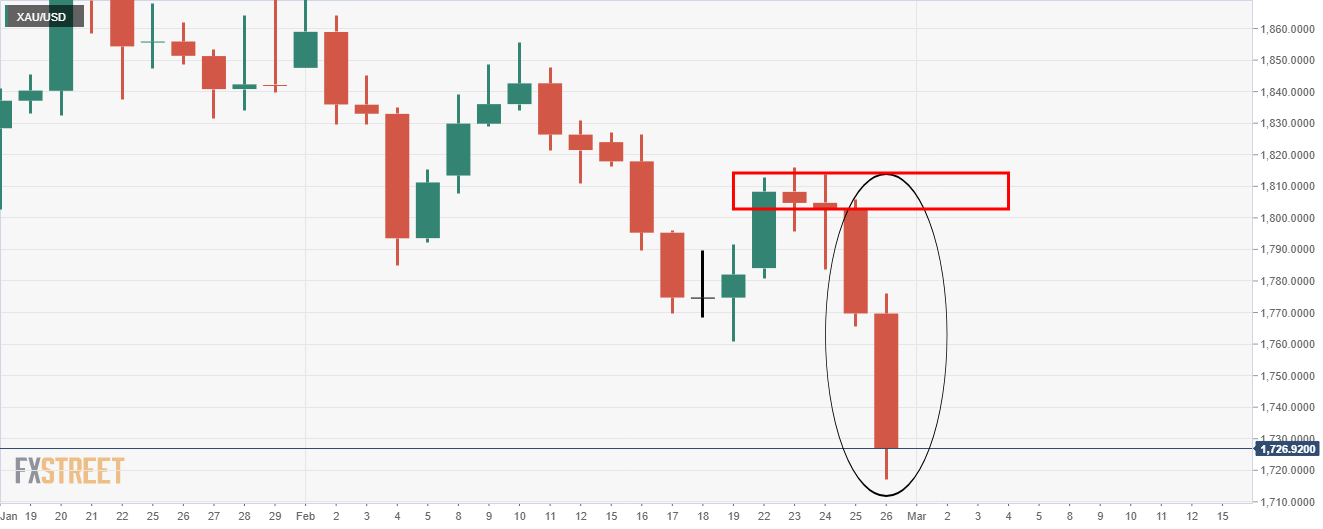
Meanwhile, the bears are testing the bullish commitments at an old area of resistance:
This area would be expected to hold initial attempts to break below.
This gives rise to the prospects of a significant correction of the recent bearish impulse.
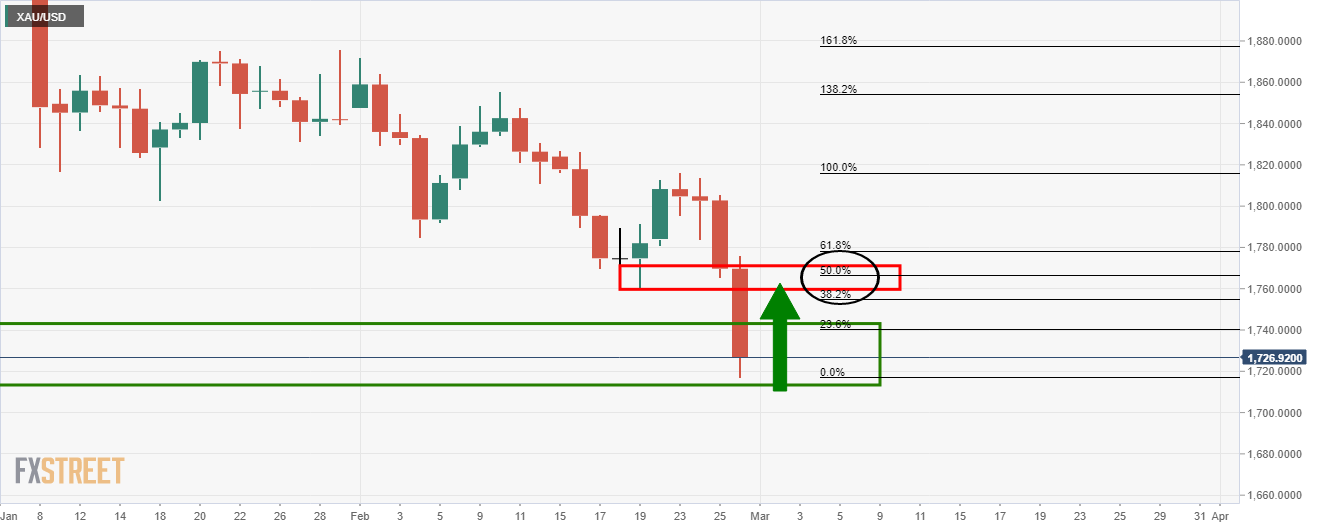
A healthy Fibonacci retracement to the region between a 38.2% Fino and the 50% mean reversion level has a confluence with the prior lows of $1,760.72.
With that being said, from an hourly perspective, there are prospects of a downside continuation to test deeper into the liquidity of the daily support and demand territory should a test of $1,735/45 prove are a strong wall of resistance.
Hourly chart
Premium
You have reached your limit of 3 free articles for this month.
Start your subscription and get access to all our original articles.
Author

Ross J Burland
FXStreet
Ross J Burland, born in England, UK, is a sportsman at heart. He played Rugby and Judo for his county, Kent and the South East of England Rugby team.


