|

Technical analysis: EUR/JPY range bound after rally retraces below 23.6% Fibonacci

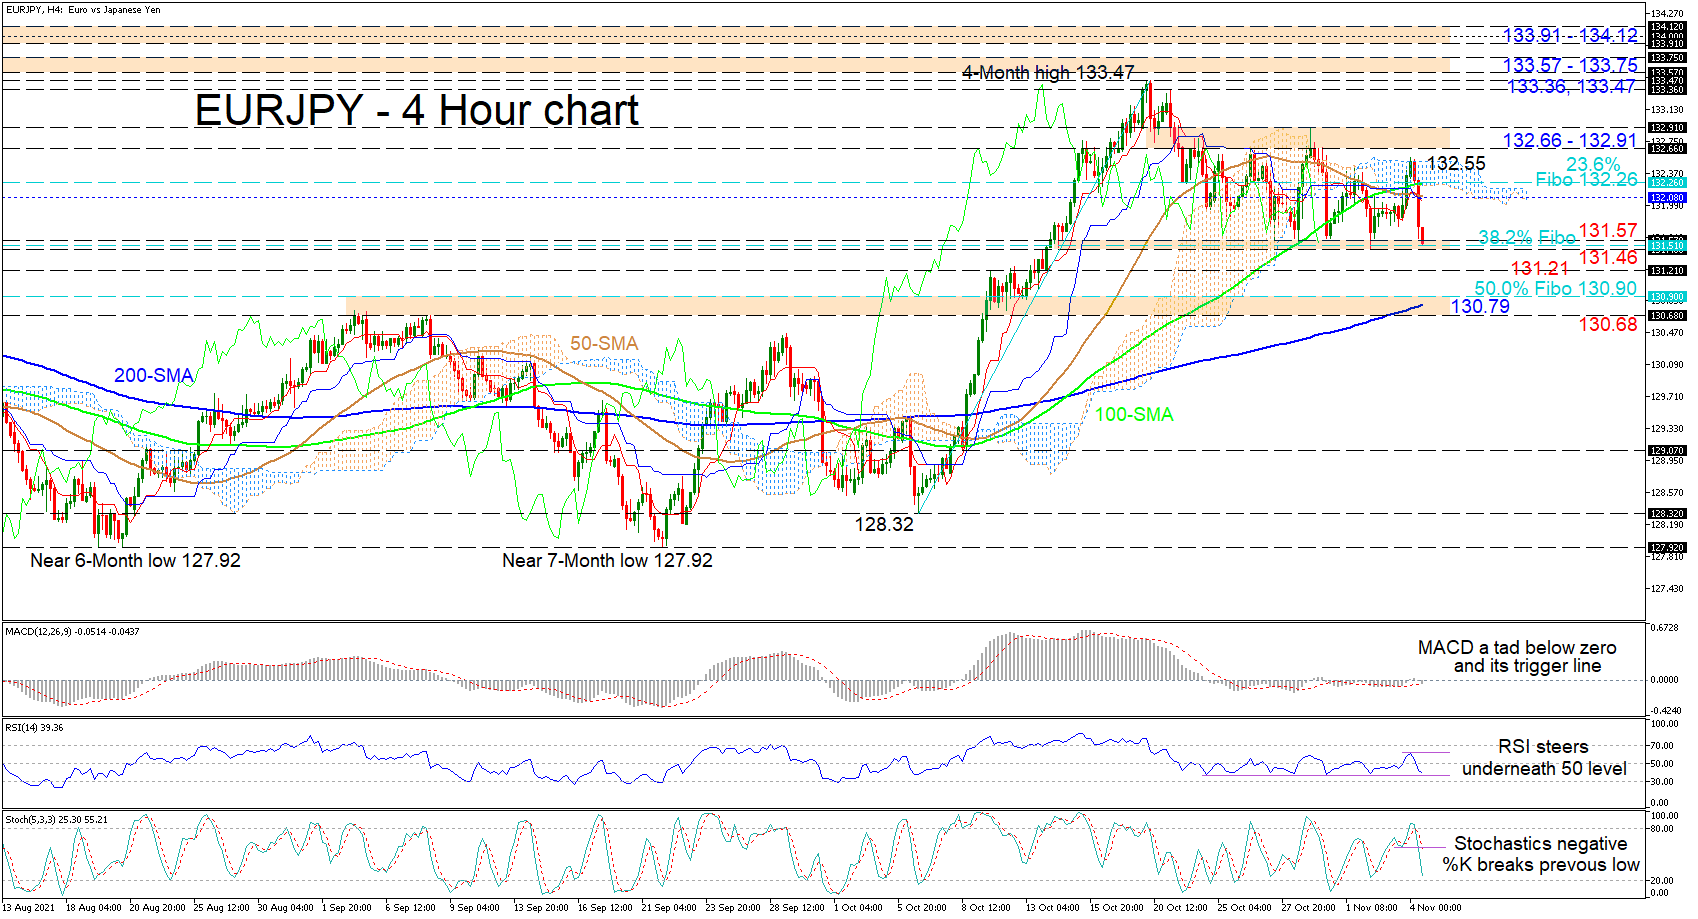
EURJPY is testing the 131.46-131.57 base of the 10-day consolidation, which is fortified by the 38.2% Fibonacci retracement of the up leg from 128.32 until the four-month high of 133.47. The pair glided into a sideways market after the rally that began off the 128.32 level surrendered some ground from the 133.47 peaks. Currently, the 50- and 100-period simple moving averages (SMAs) are not endorsing any clear price trend.

The short-term oscillators are showing that sellers are in command. The MACD is slightly beneath zero and its red trigger line. Further promoting negative price action in the pair, is the strong negative charge of the stochastic oscillator, and the RSI, which is falling in the bearish zone.

If positive impetus remains feeble, instant downside limitations could arise from the hardened floor of the trading range from 131.57 until 131.46. If sellers manage to drive the price beneath this key boundary, the price may then meet the 131.21 low before tackling another critical zone of support existing from the 50.0% Fibo of 130.90 until the 130.68 barriers, an area reinforced by the 200-period SMA at 130.79.

Alternatively, if buyers re-emerge and gain traction off the 131.46-131.57 foundation, an initial tough section of resistance could develop from the blue Kijun-sen line at 132.08 until the 23.6% Fibo of 132.26. Pushing past these multiple barriers, the 132.55 high may hinder the price from challenging the 132.66-132.91 resistance ceiling. However, conquering this, the price could propel towards the 133.36 and 133.47 peaks. From here, buyers would need to muster a more profound push to overcome the nearby resistance band of 133.57-133.75 to tackle the 133.91-134.12 obstacle, that being an area of highs identified at the beginning of June.

Summarizing, EURJPY is still neutral around the upper part of the rally despite sellers currently possessing the upper hand. A break below the 131.46-131.57 floor could boost the negative trajectory, while a jump above the 132.91 high may see buoyancy in the pair's return.
EURJPY

Author

Anthony Charalambous, CFTe

Anthony Charalambous joined XM in 2019 and specializes in preparing daily technical analysis, using his years of trading experience to provide detailed forecasting for all major asset classes such as forex, indices, commodities and equities.


More from Anthony Charalambous, CFTe
Share:

Editor's Picks

GBP/USD drops toward 1.3500 after weak UK jobs data

GBP/USD extends losses toward 1.3500 in European trading hours on Tuesday. The UK ILO Unemployment Rate held steady at 4.9% in the three months to June, against a forecast of 4.8%, while Employment Change arrived at 83K in the same period versus 147K previous. Weak UK labor data keep the British Pound under pressure, driving the pair lower.

EUR/USD flat lines below two-month high amid oil-driven inflation fears

The EUR/USD pair holds steady around the 1.1575-1.1580 region during the Asian session, and for now seems to have stalled the previous day's modest pullback from a two-month top. However, a modest US Dollar uptick warrants some caution before positioning for the resumption of the recent move higher from the 1.1350 area, or the July monthly swing low.

Gold drifts lower amid oil-driven inflation risks and US-Iran tensions

Gold attracts some sellers following a modest Asian session uptick, stalling a two-day move higher from the $4,300 neighborhood. The US Dollar builds on the overnight bounce from a two-month trough as inflation risks stemming from higher crude oil prices underpin prospects for at least one interest rate hike by the US Federal Reserve in 2026. Adding to this, the US-Iran standoff keeps the geopolitical risk premium in play and further underpins the safe-haven Greenback, which is seen exerting pressure on the precious metal.

Ripple and Stellar remain under bearish pressure as corrective declines cap upside

Ripple and Stellar remain under pressure as broader market uncertainty and weak technical momentum weigh on both altcoins. XRP is hovering below the key $1 mark on Tuesday while XLM continues its corrective decline below $0.157. Meanwhile, mixed derivatives and on-chain signals indicate cautious sentiment, leaving both cryptocurrencies vulnerable to further downside.

Silver’s new era: Supply deficits meet exploding industrial demand
Silver has experienced a wild ride in 2026, but The Silver Institute President and CEO Michael DiRienzo says investors shouldn’t let the volatility obscure a much bigger story: the underlying silver market remains remarkably strong.
Why is Crude Oil priced for a reopening the ships haven't made?
Fourteen vessels crossed the Strait of Hormuz on Tuesday. Before the war, the count ran near 120 a day. In the sessions since the waterway was publicly declared open, Brent has drifted back to $87 and West Texas Intermediate (WTI) to $81, both a little lower again on Wednesday, with daily momentum on each unwound from the top of its range in late July to the low twenties now.















